State of the Electronic Components Market: November 2025
Price inflation accelerates as AI demand, material costs, and semiconductor disruptions tighten supply
Lytica is the world’s only provider of electronic component spend analytics and risk intelligence using real customer data. As a result of our unique position in the marketplace, we’ve been able to work with 100+ customers in analyzing over $550 billion in electronics spend. We’ve curated up-to-date insights on the state of the electronic component market and will be sharing them with you each month.
Lytica’s component basket comprises 165,000 electronic components across more than 30 categories, including the most popular devices used by our customers. These indices are intended to show market trends. Individual component and BoM analysis is offered by Lytica as a service to our customers.
Price Inflation Accelerates in November in October
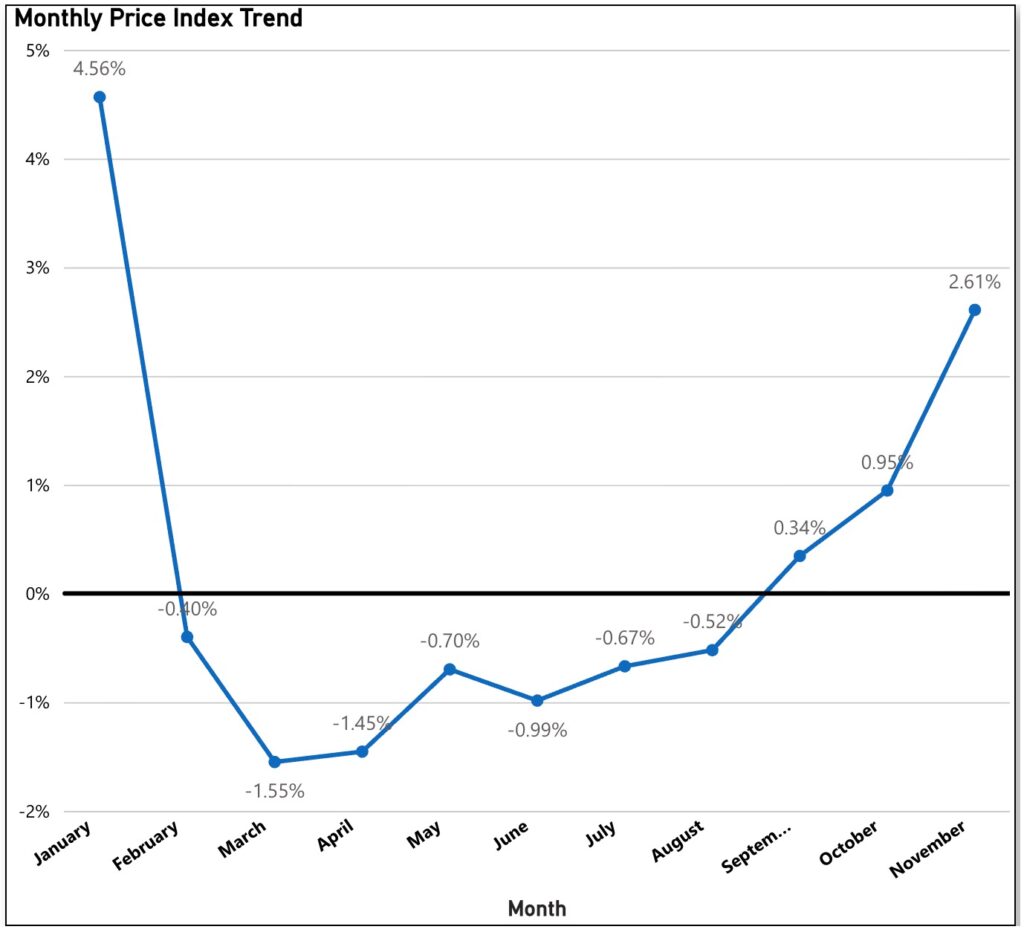
November marked a clear acceleration in pricing across the electronic components market. The overall pricing index rose 2.61% month over month, the largest increase of 2025 and the third consecutive month of gains following September and October’s inflection.
This confirms that the market has entered a more inflationary phase, driven by AI infrastructure demand, spikes in battery material costs, semiconductor supply disruptions, and record-high copper prices.
Key Pricing Drivers
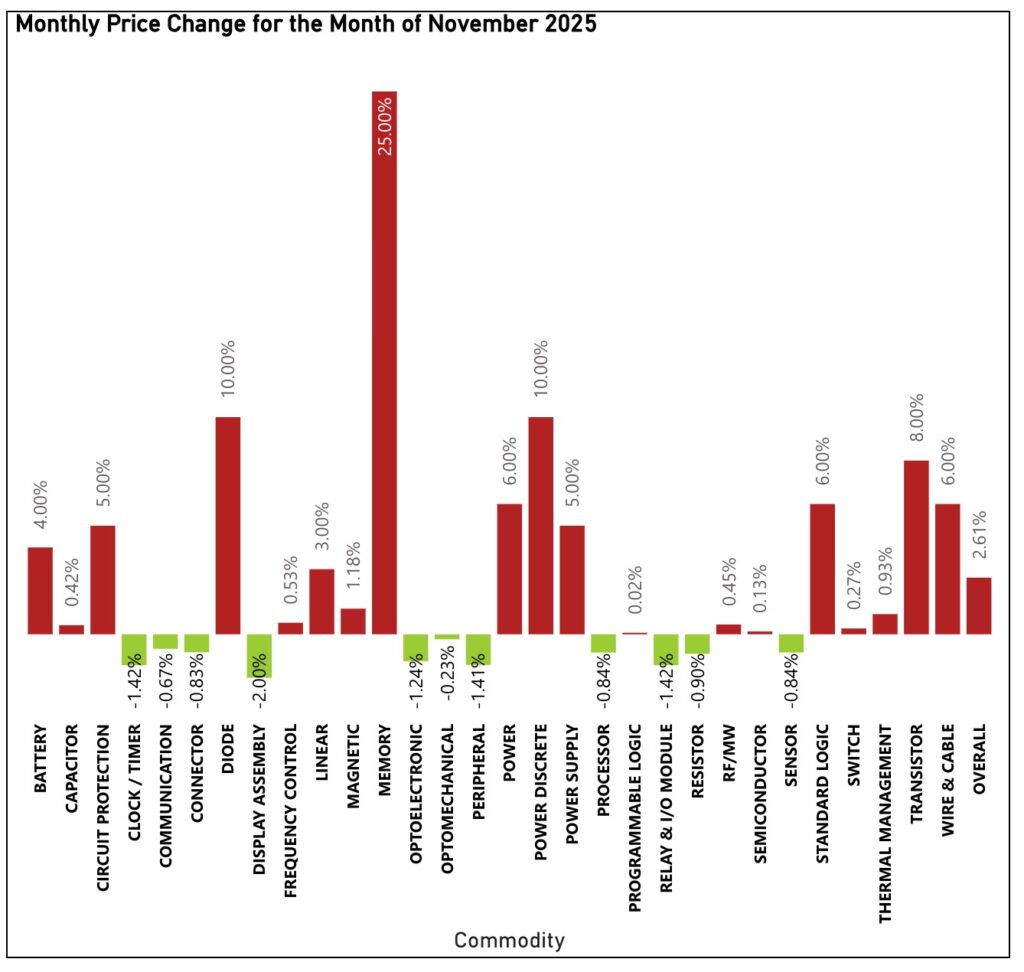
Memory pricing was one of the strongest contributors to November’s inflationary move, rising approximately 25% month over month, driven by accelerating demand for AI infrastructure. As companies expanded AI server deployments, suppliers, including Samsung, implemented 30–60% increases in contract pricing for DDR5 (the latest generation of high-performance server memory). This pushed 32 GB modules from $149 to $239, with similar increases across other capacities, reinforcing memory as one of the most inflationary categories in the market.
Battery and energy storage components also moved higher as upstream material costs surged. Lithium carbonate prices rose to RMB 85k–92k per metric ton (roughly +10% MoM), while upstream lithium inputs such as spodumene, a key lithium ore, climbed nearly 18%. Electrolyte inputs rose even faster, with LiPF₆ up approximately 90% month over month, driving higher costs for lithium-ion battery cells and power systems.
On the semiconductor side, a geopolitical dispute forced Nexperia to suspend shipments, creating shortages in diodes, transistors, MOSFETs (core switching devices used in power and signal control), and circuit-protection components. Prices for certain Nexperia parts doubled, triggering ripple effects across the broader discrete semiconductor market, with Diodes and Power Discretes rising roughly 10%, Transistors increasing approximately 8%, and Circuit Protection components climbing about 5%, reflecting the rapid pricing impact of supply and substitution pressure across the market.
Rising raw materials costs added further pressure. Copper prices hit a new record, with the London Metal Exchange (LME)—the global benchmark for industrial metals—reaching $11,210 per tonne, surpassing October’s previous high. This directly affected wire and cable, rising approximately 6%; printed circuit boards (PCBs) and other copper-intensive components also rose, reinforcing inflation across multiple assemblies tied to electrification and infrastructure expansion.
Analog suppliers such as Texas Instruments implemented price increases of roughly 30% across analog portfolios, and when combined with the Nexperia disruption, these hikes pushed pricing higher across power discretes and power-supply components, rising 10% and 5% respectively.
One of the few offsets in November came from display technologies. Demand for display panels softened, prompting TV panel suppliers to reduce prices by $1–$ 3, depending on panel size. As a result, display assemblies saw modest price relief, standing out as an exception in an otherwise inflationary month.
Lead Time Pressures Remain Elevated
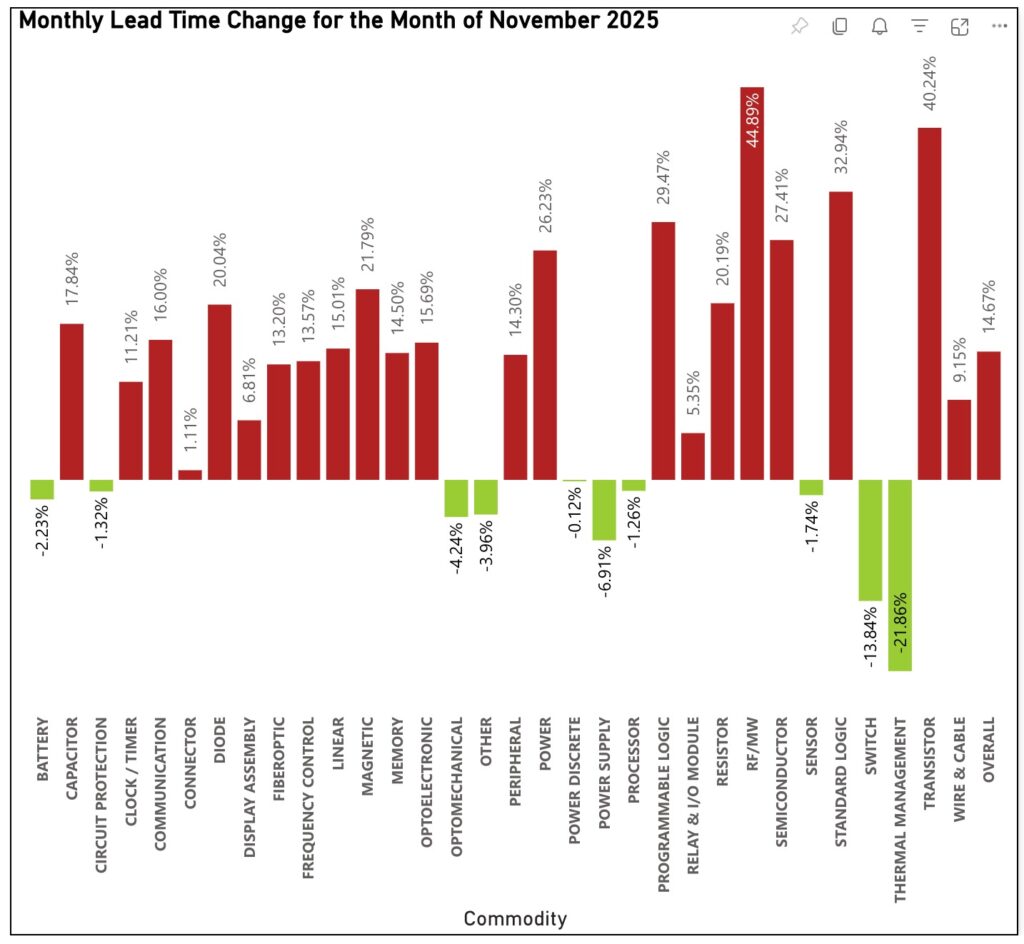
Lead times remained elevated in November. While the pace of increase moderated from summer highs, lead times remain above early-year levels.
Upward pressure persisted across RF/MW (Radio Frequency/ Microwave), increasing 44.89%, transistors increasing 40.24% month over month, and standard logic increasing 32.94% month over month, with only limited relief in select categories, such as thermal management at –21.86% month over month, switches decreasing lead time by –13.84% month over month and power supply decreasing at -6.91% month over month.
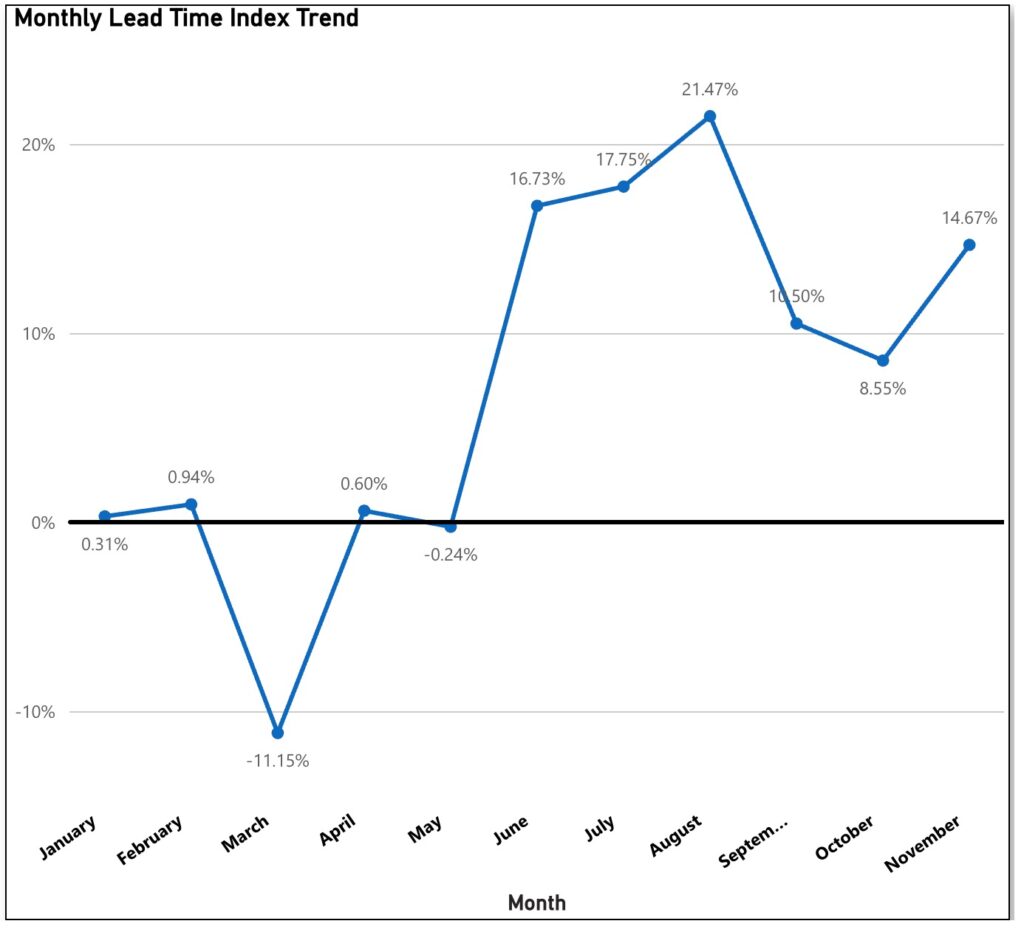
The lead time index trend shows a sharp escalation beginning in June, rising from 16.73% to 21.47% in August, then easing slightly through September and October. However, by year-end, we see that the index trend for lead time is elevated to 14.67% in November.
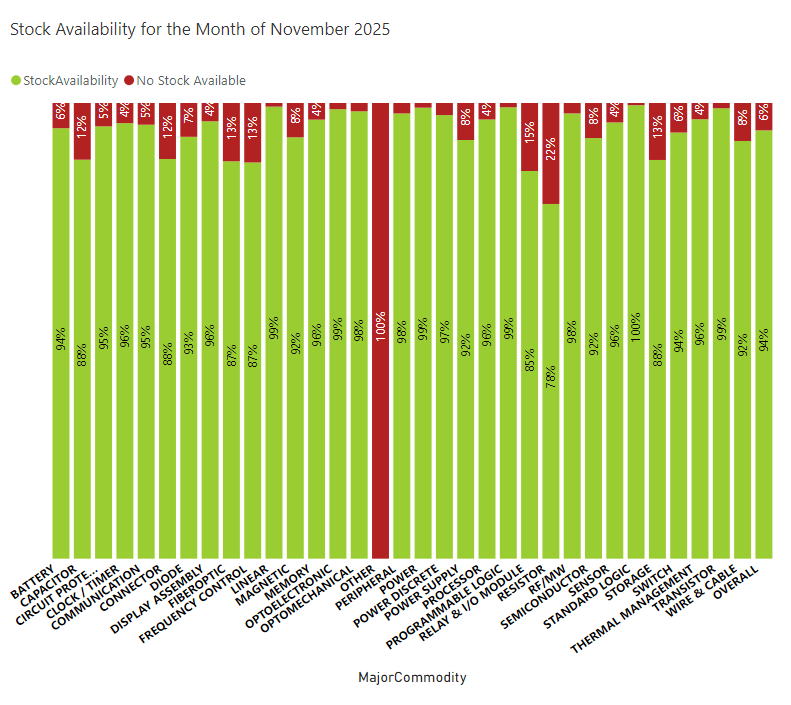
Stock Availability Remains High
In November, stock availability remained high at 94% overall, reflecting a stable supply environment across most component categories. Several major commodities continued to show strong availability, including Standard Logic (100%), Power (99%), Linear (99%), Optoelectronic (99%), Programmable Logic (99%), and Transistors (99%). Other categories also remained elevated, including Radio Frequency/Microwave (RF/MW +98%), Power Discretes (97%), and Sensors (96%).
A few categories showed noticeably tighter conditions, particularly Resistors (78%) and Relay & I/O Modules (85%), while Capacitors (88%), Connectors (88%), and Storage (88%) also trailed the highest-availability groups.
Market Outlook
November confirms that October’s pricing inflection was not temporary. Instead, the market has entered a period of selective, demand-driven inflation, led by AI infrastructure buildouts, battery material volatility, semiconductor supply disruptions, and persistent copper exposure.
As the market moves toward Q1 2026, buyers should expect continued volatility and increased negotiation pressure, reinforcing the importance of market-based benchmarking over the last price paid.
Sign up for our newsletter for more on the electronic components market.