In my last blog, Manufacturing Sector- The growth engine of the economy, I touched upon the complex nature of business stemming from globalization and international markets. In today’s unpredictable times, the need for understanding not only the trend of the economy but its respective business sectors, commodities and currency markets while foreseeing their course to draw out a company’s future strategies has become all the more challenging.
So how can businesses foresee the future, predict the health of the economy and draw out their business strategies?
In this write up, I’ll focus on some predictive statistical modeling to forecast the GDP by considering the relationships that exist between several commonly suspected driving forces of the economy and the GDP.
Predictors – Driving Forces
- Labor – Availability of labor force is important for any country to grow and sustain the economy. For the purpose of evaluating total labor force, those who meet the International Labour Organization definition of the economically active population have been taken into consideration. As expected China, India and the USA feature in the top 5 of this group.
- Life Expectancy – The changing trend of the average age human beings are expected to live can indicate the effort and investment put into the health care system by the government. The assumption here being that increased life expectancy will positively affect the economy.
- Human Capital (Education spending) – As skills, knowledge and ideas can drive innovation, productivity and, in turn, economic growth, government expenditure on education expressed as a percentage of GDP becomes an important variable to study.
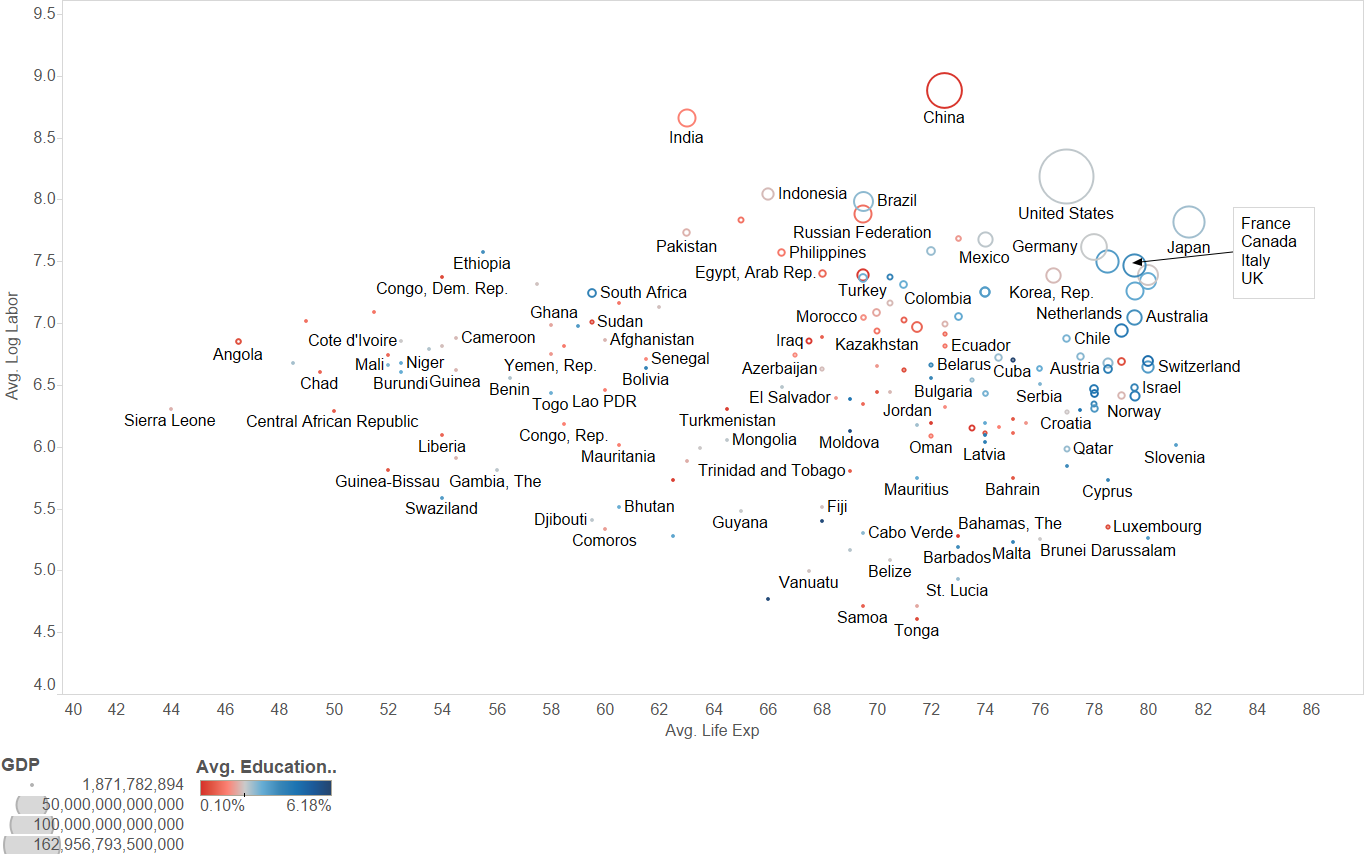
(Chart details – Average life expectancy vs average log labor. Color showcase average of education spending %. Size showcase average GDP figures. All figures are between 1990 & 2014)
Putting the first three predictor variables on a bubble chart provides a visual representation of their effects on the GDP. It can be seen how some of the most developed economies of the world also possess high average life expectancy figures, with Japan having the best (above 80 years).
Intuitively one would expect the developed economies to spend more on education, which is exactly the case here with all the developed economies shown in blue and developing economies in red; more effort in the direction of education is required from the up and coming economies.
- Energy Consumption – Total consumption of energy, including renewable, nuclear and non-renewable. For growing economies an increase in energy consumption is closely related to the growth in modern sectors such as industry, motorized transport and urban areas.
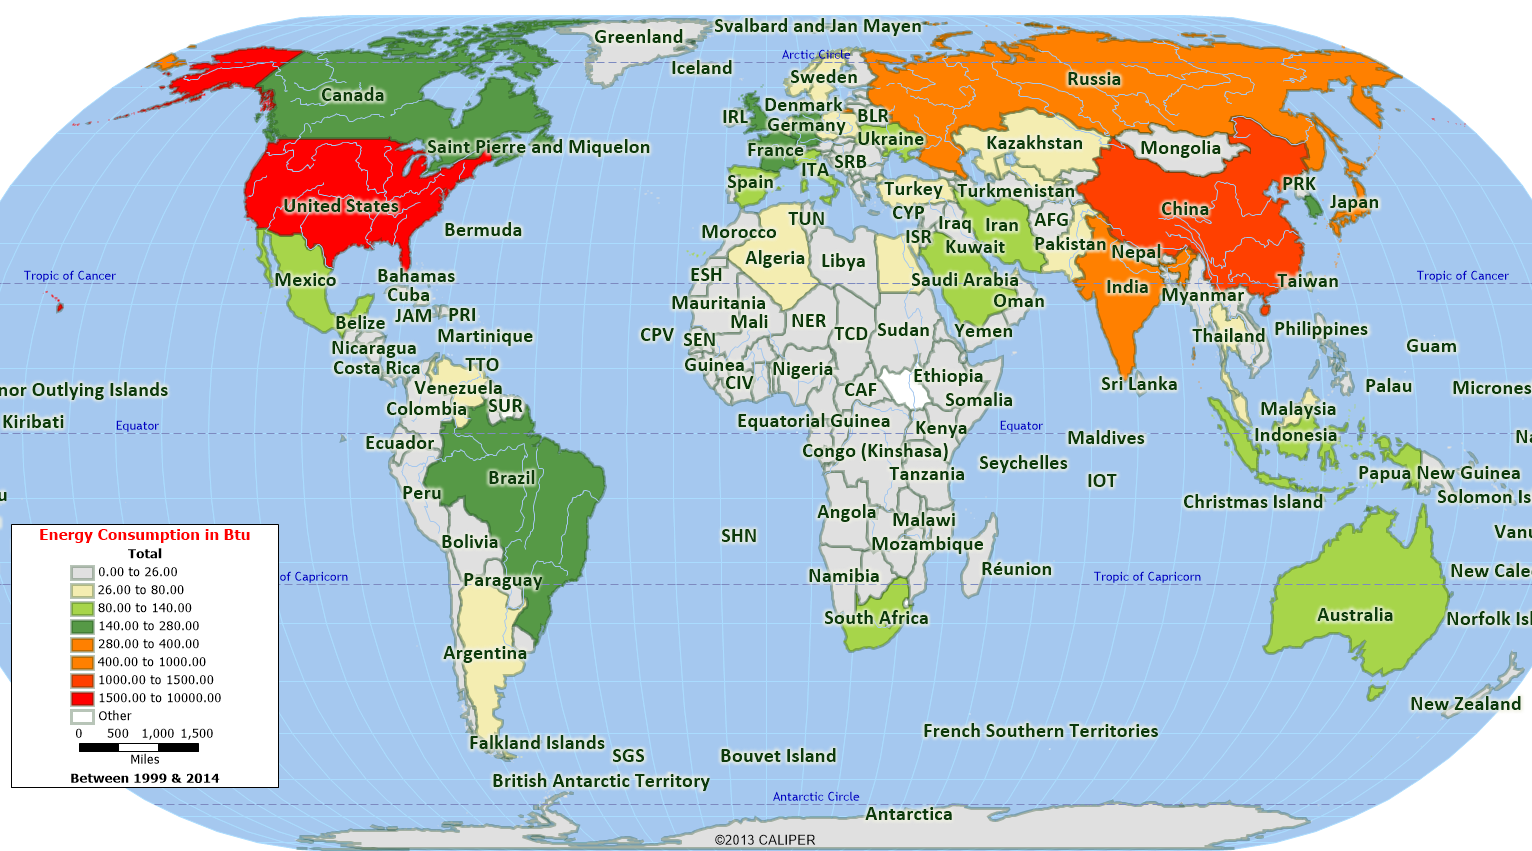
(Total energy consumption between 1990 and 2014 in Quad BTU)
The world map above showcases the total energy consumption from 1990 to 2014 in quad Btu. It is stunning to realize that the top 5 consumers, which include the USA, China, Russia, Japan and India, accounted for over 50% of the total energy consumption. The next 25 countries in the list, including developed European economies, big oil producing middle-eastern countries and some of the fast-developing nations such as Thailand consume 35% of the total.
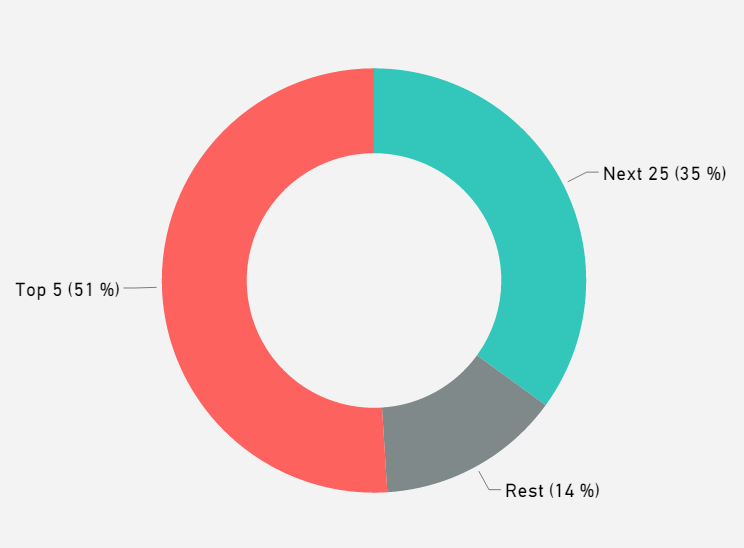
(Top Energy Consumers)
Statistical Modelling
A multivariate analysis is a great tool to seek and understand the relationships between all of the predictor variables and the GDP (figures between 1990 and 2014, as discussed in the first blog). There are several easy to navigate statistical software applications in the market, for this analysis I used JMP SAS.
Scatter Plot Matrix
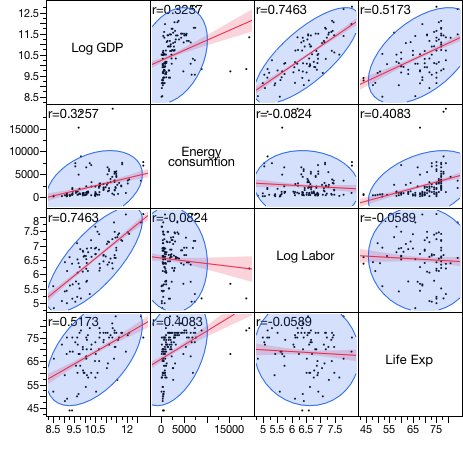
The scatter plot highlights the correlation between GDP growth and all the predictor variables used in the analysis. Availability of skilled labor force best explains the growth in GDP with a positive correlation coefficient of 0.746 followed by life expectancy (0.517) and energy consumption (0.325).
Now that we are satisfied to see positive correlations, regression analysis will uncover the exact nature of the relationships and help in forecasting/estimating the GDP.
Summary of Fit
| RSquare | 0.903911 |
| RSquare Adj | 0.903053 |
| Root Mean Square Error | 0.290362 |
| Mean of Response | 10.45144 |
| Observations (or Sum Wgts) | 340 |
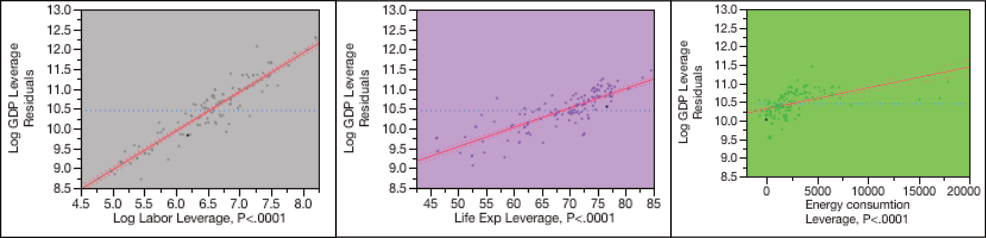
A high RSquare (explained variations/total variation) indicates that the model explains over 90% variability of the response data (GDP) around its mean. The linear relationship (univariate relationships) can be seen in the graphs below.
Finally, without using too much statistical verbiage, it’s important to verify the F-test (variations between the sample means and sample), the corresponding p-value and residuals (difference between observed GDP and predicted values).
Parameter Estimates
| Term | Estimate | Std Error | t Ratio | Prob>|t| |
| Intercept | 0.5587041 | 0.188706 | 2.96 | 0.0033* |
| Log Labor | 0.9806797 | 0.021051 | 46.59 | <.0001* |
| Life Exp | 0.0489376 | 0.001869 | 26.18 | <.0001* |
| Energy consumption | 5.6364e-5 | 5.428e-6 | 10.38 | <.0001* |
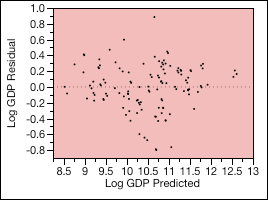
A p-value lower than 0.05 (5%) and a random looking residual plot with points centered around zero convey that the effects and observed relationships in the sample data can be extended to the overall population.
Regression Model
Log GDP = 0.56 + 0.98 (Log Labor) +0.05 (Life Expectancy)
- GDP and Labor are changed into log values to better fit the model
- Energy consumption has a very low coefficient so it’s been removed
Conclusion
Based on the analyses it can be said that GDP might be improved by increasing the availability of skilled labor. Positive relationships with energy consumption and life expectancy (though with smaller coefficients) can, to a certain extent, help in predicting GDP. It is possible that some of the positives attained through increased life expectancy are offset by increased expenditure on long-term care as the population ages.
For further research, other important driver variables explaining areas such as ease of doing business, innovation, technology level, etc. can be taken into consideration to optimize this regression model and enhance its explanatory power.
A Look into the Future
Historically, skilled immigrants have been an important contributor to the labor force, especially true in the case of OECD countries (Organization for economic co-operation and development), which include many of the high income and developed economies such as the USA, UK, Spain and Canada.
Despite accounting for about only 13 percent of the population, immigrants in the USA start more than a quarter of new businesses. Coincidentally the USA has also awarded the highest number of patents (194,600) to immigrants; more than any other country in the last decade.
Interestingly a significant proportion of the engineers and scientists in the USA are also foreign. There are around 115,000 international scholars working at colleges and universities as researchers, instructors and professors.
Furthermore, in 2014, close to 21% of the CEOs on Inc.’s 500 list – leaders of the fastest growing private companies in the USA – were foreign born and, in 2010, nearly $775 billion in sales were generated from immigrant owned businesses. This illustrates that migrant contribution to the growth of the economy (including higher taxes and other social contributions) is more substantial than the individual benefits received.
Conversely, the advent of many technological breakthroughs has the potential to transform and redefine the manufacturing sector. Although the trained labor force has been a critical aspect of the economy and overall growth, highlighted by the regression analysis above, the rise in effectiveness of artificial intelligence and robots could very well change this trend. The possibility of machines substituting human capital in the near future is becoming a realistic scenario.
In a survey of industrial manufacturing CEOs conducted by PwC in 2016, over fifty percent of the interviewed executives were expecting new opportunities coming from technological advancements and product and service innovations. This is a clear indicator of the importance in making strategic and well informed decisions which are in line with changing demands and economic background in order to fulfill customer expectations.
Would it be safe to say that having a free movement of labor will help steer the global economy in the right direction and any restrictive immigration policies would deter innovation, technology and entrepreneurial growth? Or will AI and robotics become the driving forces of the future economy?
Vijay Raj is a data analyst with a background in Supply Chain (MBA, Schulich School of Business, York University – Toronto) and economics (Masters, Universite de Perpignan-France).
References
- U.S. Energy Information Administration – EIA Independent Statistics and Analysis. (n.d.). Retrieved April 06, 2017, from https://www.eia.gov/beta/
- (n.d.). Retrieved April 06, 2017, from http://data.worldbank.org/indicator
- (n.d.). Manufacturing Barometer™. Retrieved April 06, 2017, from http://www.pwc.com/us/en/industrial-manufact uring/barometer-manufacturing.html
- Friesen, J. (2013, January 10). How immigrants affect the economy: Weighing the benefits and costs. Retrieved April 27, 2017, from http://www.theglobeandmail.com/news/national/time-to-lead/how-immigrants-affect-the-economy-weighing-the-benefits-and-costs/article4106049/
- Estrada, C. M. (2016, July 14). How Immigrants Positively Affect the Business Community and the U.S. Economy. Retrieved April 27, 2017, from https://www.americanprogress.org/issues/immigration/news/2016/06/22/140124/how-immigrants-positively-affect-the-business-community-and-the-u-s-economy/