Analyze financial health to prevent catastrophic risk in your supply chain
With increasing occurrences of disturbing events, such as companies going bankrupt, how to predict and prevent the catastrophic risk becomes one of the most important considerations of executives and managers. Such events could adversely impact production and order fulfillment, resulting in financial loss as well as brand damage.
Considering data collectability, accuracy and comparability, data from financial statements is applied to evaluate and predict the catastrophic risk.
- Financial Risk Evaluation
Measures used to evaluate company performance are broken into four aspects; liquidity, solvency, profitability, and future growth. Periodically collecting data and monitoring the trends of these measures will help you better understand the financial health of your suppliers and catch the early warning signs of catastrophic risk.
Liquidity Measures
Liquidity measures help to evaluate the company’s ability to meet its short-term obligations. For current and quick ratios, the larger, the better.
Current Ratio = Current Assets/Current Liabilities
Quick Ratio = (Current Assets-Inventories)/Current Liabilities
This measure is demonstrated below using two suppliers as examples; both are connector manufacturers:
| Liquidity Measure | Supplier A (2015) | Supplier B (2015) |
| Current Ratio | 3.82 | 2.20 |
| Quick Ratio | 2.97 | 1.75 |
While Supplier A has stronger liquidity ability compared to Supplier B, both suppliers have sufficient current assets to fulfill their current liability obligations. There is no obvious risk of illiquidity for either of them. A ratio of less than 1 would be a concern because the company may have problems meeting its short-term liabilities.
Solvency Measures
Solvency measures help to evaluate the company’s ability to meet its long-term obligations.
Debt to Equity = Total Debt / Total Equity
A rising debt-to-equity ratio implies increasing interest expenses. The company’s credit rating would be impacted if the debt-to-equity ratio climbs beyond a certain threshold, making it more expensive to raise more debt.
Debt to Assets = Total Debt / Total Assets
The higher the ratio, the higher the financial risk.
We continue with Suppliers A and B to interpret the solvency measures:
| Solvency Measure | Supplier A (2015) | Supplier B (2015) |
| Debt/Equity | 1.28 | 1.15 |
| Debt/Assets | 0.56 | 0.53 |
Both suppliers have stable and balanced Debt/Equity and Debt/Assets ratios. There is no sign of having solvency problems.
As for the Debt/Equity ratio, Joe Knight, author of the HBR TOOLS: Return on Investment, gives a few rules of thumb:
“Technology-based businesses and those that do a lot of R&D tend to have a ratio of 2 or below. Large manufacturing and stable publicly traded companies have ratios between 2 and 5. Any higher than 5 or 6 and investors start to get nervous.” – Joe Knight
Based on this analysis, it is safe to draw the conclusion that both suppliers have healthy financial situations in the short and long-term however, it only evaluates a supplier’s past financial health. It is also necessary to look into their prospects.
A more cautious way of evaluating a company’s solvency capability is to remove goodwill from its total assets as it is neither money nor a fixed asset which is available. The company cannot use goodwill to pay off its debt and the value for goodwill can be manipulated (making it less accurate). Essentially, goodwill is just a number sitting on the financial statement.
| Solvency Measure | Supplier A (2015) | Supplier B (2015) |
| Debt/(Assets-Goodwill) | 0.88 | 0.70 |
After adjustment, the ratios for both suppliers increase significantly but remain in a healthy position.
Business Sustainability (Profitability + future growth)
Growth margin is used to measure the company’s profitability while revenue growth and capital expenditure (CapEx) to revenue is applied to measure their future growth capabilities. Continuous year-over-year revenue growth and stable CapEx to sales imply a good operating and financial situation.
Gross Profit Margin = Gross Profit / Net Sales
YOY Growth Rate = (Sales this Year – Sales last Year) / Sales last Year
| Business Sustainability | Supplier A (2015) | Supplier B (2015) |
| Gross Profit Margin | 32% | 33% |
| YoY Growth Rate | 4.18% | 2.17% |
| CapEx/Revenue | 3.0% | 4.9% |
Both companies show positive prospects in the near future as their gross margins, growth rates and CapEx/sales look optimistic.
By tracking the time series data for companies and comparing it with competitors and the industry average a clearer understanding of the development and the position of companies becomes available. Any variation across time is worth investigating.
- Operation Risk Evaluation
Working capital, inventory turnover, Days Sales Outstanding (DSO), Cash-to-Cash Cycle (CCC) time and operating profit margin are effective measures to evaluate a company’s operational efficiency and aid in determining whether your suppliers are facing serious financial issues. The lower the operational efficiency, the higher the catastrophic risk.
Working Capital Per Dollar of Sales = (Current Assets – Current Liabilities)/Sales
Days of Inventory Turnover = 365/(COGS/Average Inventory)
Days Sales Outstanding = Accounts Recievables / Sales
Operation Profit Margin = EBIT/Net Sales
Cash-to-Cash Cycle (CCC) Time = Days inventory on hand + Days sales outstanding – Days payables outstanding
| Operational Efficiency | Supplier A (2015) | Supplier B (2015) |
| Working Capital | 51% | 35% |
| Days of Inventory Turnover | 83 | 69 |
| Days Sales Outstanding | 57 | 63 |
| CCC | 98 | 82 |
| Operation Profit Margin | 20% | 14% |
It is difficult to evaluate a company’s financial health without comparing it to their peers and the industry average. Make sure that your comparison consists of suppliers who compete in the same industry, then benchmark their performance against industry leaders and industry average numbers to accurately pinpoint the position of suppliers in the same arena.
- Tailor supplier catastrophic risk weighting matrix for your company
Data in the table below provides a snapshot of the financial situation of four suppliers.
| Financial Measure | Supplier A (2015) | Supplier N (2015) | Supplier K (2012) | Supplier S (2014) |
| Current Ratio | 3.82 | 1.89 | 1.23 | 0.89 |
| Quick Ratio | 2.97 | 1.15 | 0.97 | 0.81 |
| Debt/Equity | 1.28 | 0.80 | 0.80 | 6.75 |
| Debt/Assets | 0.56 | 0.55 | 1.86 | 0.87 |
| Debt/(Assets-Goodwill) | 0.88 | 0.85 | 1.98 | 0.92 |
| Gross Profit Margin | 32% | 46% | 14.4% | 8.9% |
| YoY Growth Rate | 4.18% | 8.00% | -19.00% | 23.70% |
| CapEx/Sales | 3.0% | 5.5% | 2.0% | 9.2% |
| Working Capital/Sales | 51.0% | 37.0% | 13.8% | -14.3% |
| Days Sales of Inventory | 83 | 145 | 60 | 38 |
| Days Sales Outstanding | 72 | 67 | 83 | 69 |
| Days Payable Outstanding | 57 | 197 | 44 | 198 |
| CCC | 98 | 15 | 99 | -91 |
| Operation Profit Margin | 20.0% | 33.0% | -38.0% | -21.6% |
The financial health for Suppliers A and N is very good, Suppliers K and S are facing some degree of financial distress. Their profit margins are negative, which means that the more they sell, the less money they earn. Also, their debt levels are high, bringing in more financial risk. In the case of Supplier S, it’s working capital is insufficient to maintain a sustainable business. This suggests that Suppliers K and S should be placed on a watch list in order to monitor their performance more frequently and shift procurement away from them gradually.
The above indicators are suggested to evaluate the suppliers’ financial health, you can also tailor the financial indicators to build a supplier catastrophic risk matrix to help your company identify high risk suppliers and adjust your purchasing strategy.
Predict the risk of bankruptcy
The Z-Score, developed by Dr. Edward I. Altman in 1968, is the most widely tested and accepted bankruptcy predictor in use. It has a reported 72% accuracy in predicting bankruptcies two years in advance.
The Altman Z-score is calculated as:
Z-Score = ([Working Capital / Total Assets] x 1.2) + ([Retained Earnings / Total Assets] x 1.4) + ([Operating Earnings / Total Assets] x 3.3) + ([Market Capitalization / Total Liabilities] x 0.6) + ([Sales/ Total Assets] x 0.999)
![]()
You can get the Z-score of your suppliers instantly via our website here
Build up your catastrophic risk management program
Supplier’s catastrophic risk must be minimized as there is little you can do once it happens. Prediction and prevention of such risk is critical to strengthen the robustness and stability of your supply chain. Our recommended steps to build your own catastrophic risk management program can be found below:
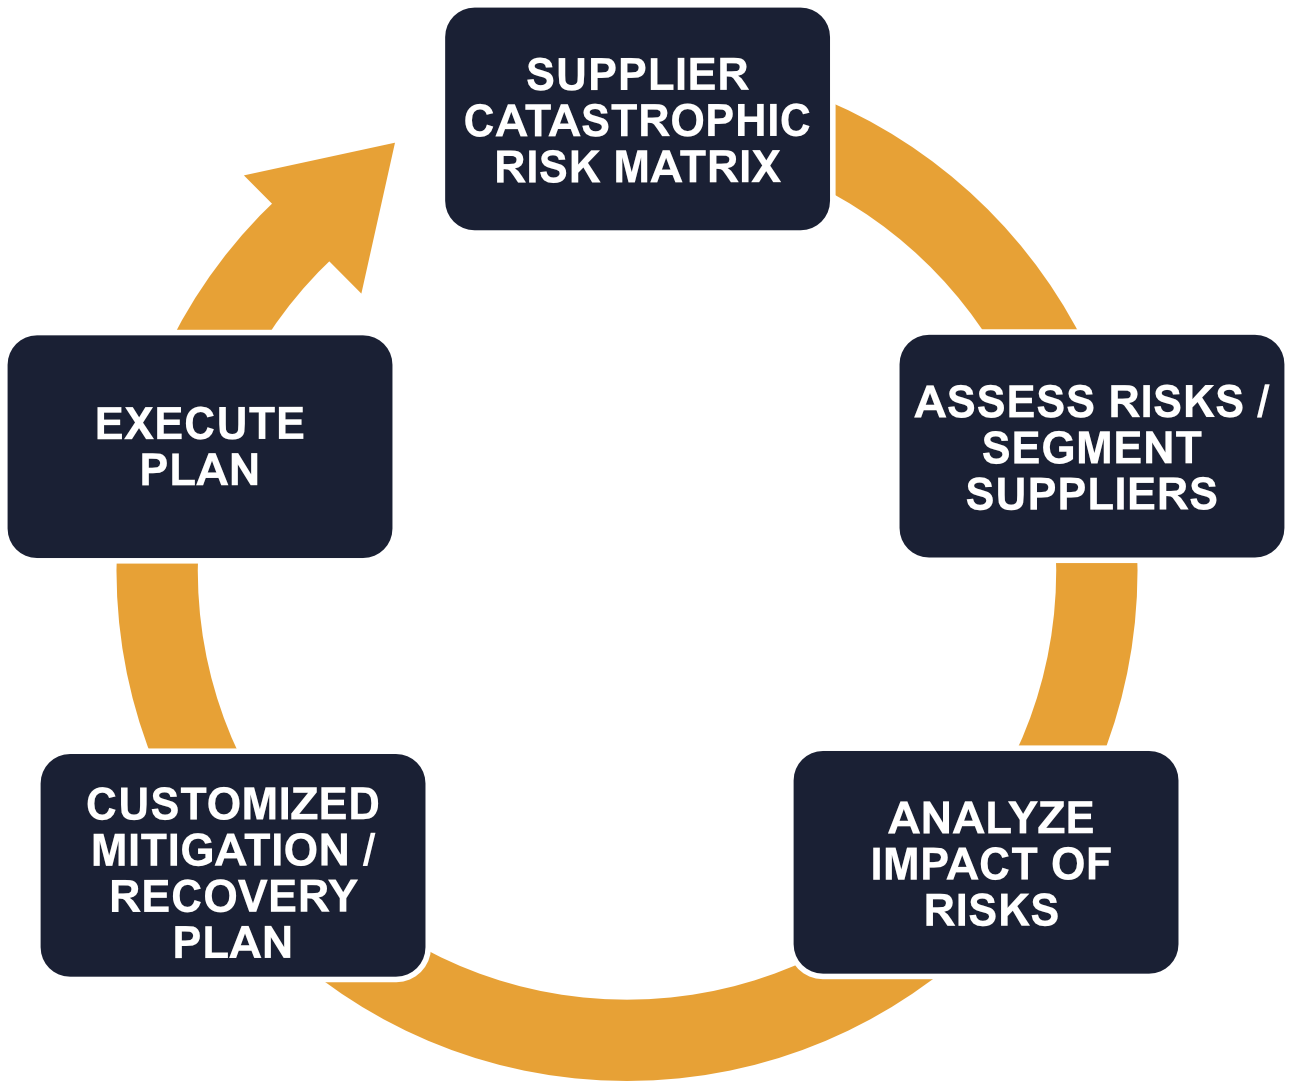
Step 1: Create a supplier catastrophic risk matrix to rate the risk level of suppliers
Step 2: Assess risks and segment suppliers according to risk levels
Step 3: Analyze the impact of potential risks
Step 4: Customize the mitigation and recovery plan
Step 5: Execute the plan and refresh the matrix if necessary
Living in a constantly changing world, the establishment and enforcement of a supplier catastrophic risk management program is no longer a nice-to-have but a must-have and should become an integral part of your company.
Han Di is a contributor at the operational and strategic levels in supply chain development and is a Supply Chain Specialist at Silecta Inc., a supply chain services company.