Electronic Component Price vs. Volume: Breaking Down Correlation Misconceptions
There is a common belief that there is a relationship between the price and volume of electronic components. Often, distributors’ websites show a price-volume relationship, and companies can get a better price when volumes increase significantly. For example, fleet sales to car rental companies provide a lower cost per car than buying a single vehicle.
At Lytica, we collect real data – anonymized and aggregated – provided by real companies. Companies supply their data because our platform lends to continuous improvement of their supply chain model. Because we source real-world data, we can understand trends in the electronic component supply chain market.
After assessing our data, as seen in the graph below, we found no credible correlation between price and volume.
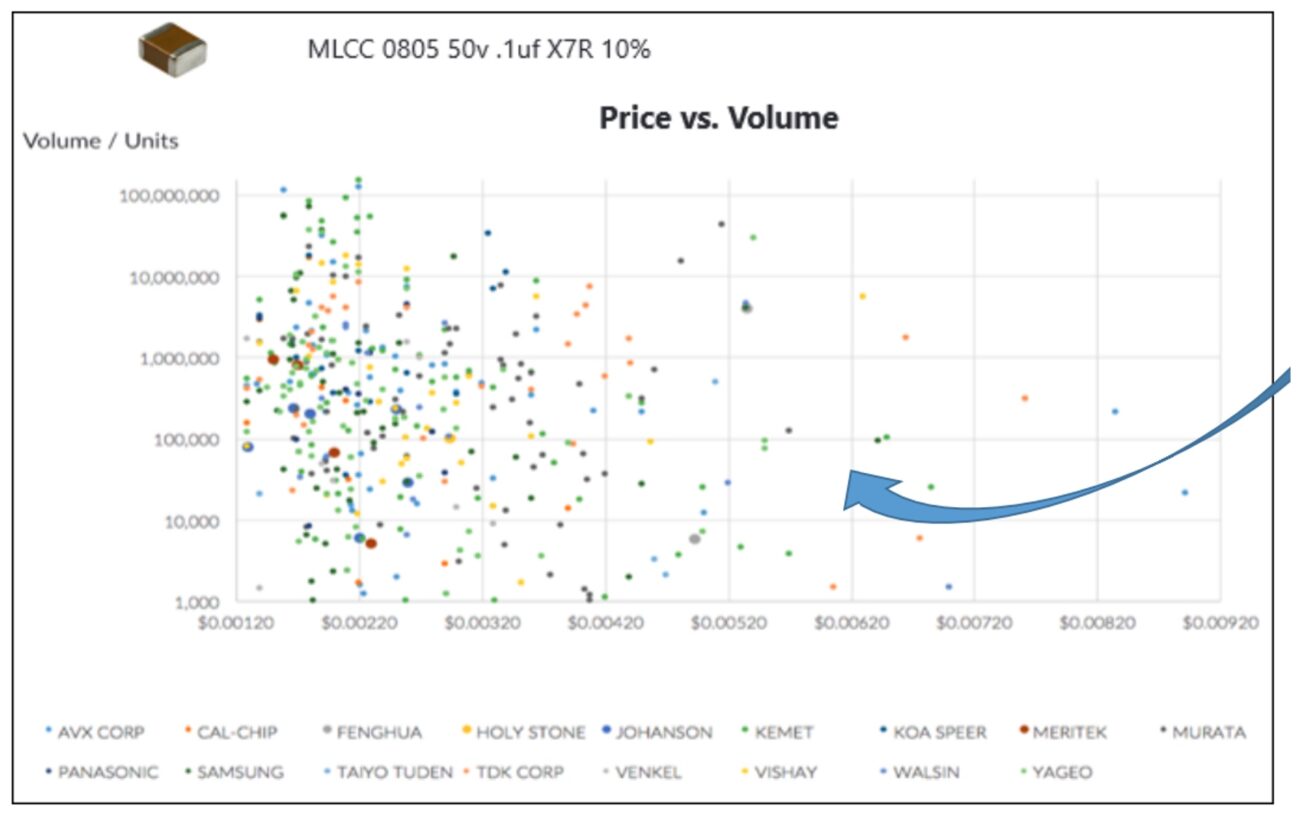
Debunking Price vs. Volume Correlation
Can both beliefs be true? How might this be possible?
Let’s dive a bit further with examples.
Single-Component Company Price vs. Volume Relationship
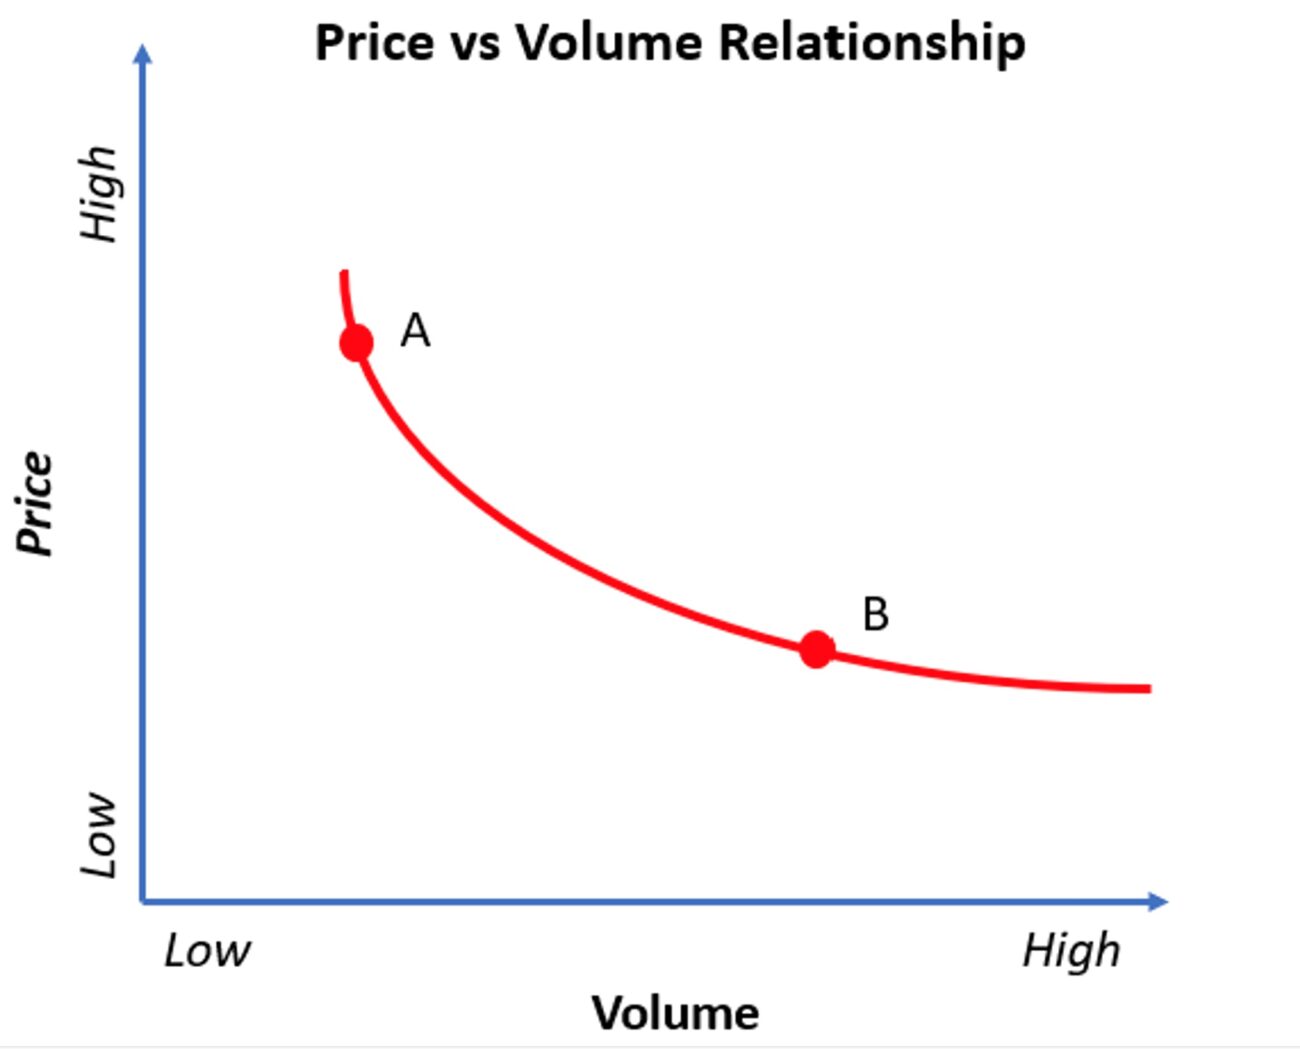
The graph below shows a company’s price vs. volume relationship that sources single-component, single-customer parts. The low volume price “A” is higher than the higher volume price “B.” Therefore, when this company completes negotiations, they are happy they negotiated to “B” given their volumes.
Comparing Three Single Component Companies Price vs. Volume Relationship
Now, let’s go a little further and add the results of two additional companies to our graph (shown below). This graph shows three companies negotiating the same part for the same volume. Each company sees a volume price relationship, but the company in red could get the grey company’s price at a fraction of the volume. This is true for the blue company against red’s and grey’s price curves. So they are all on different price vs. volume curves.
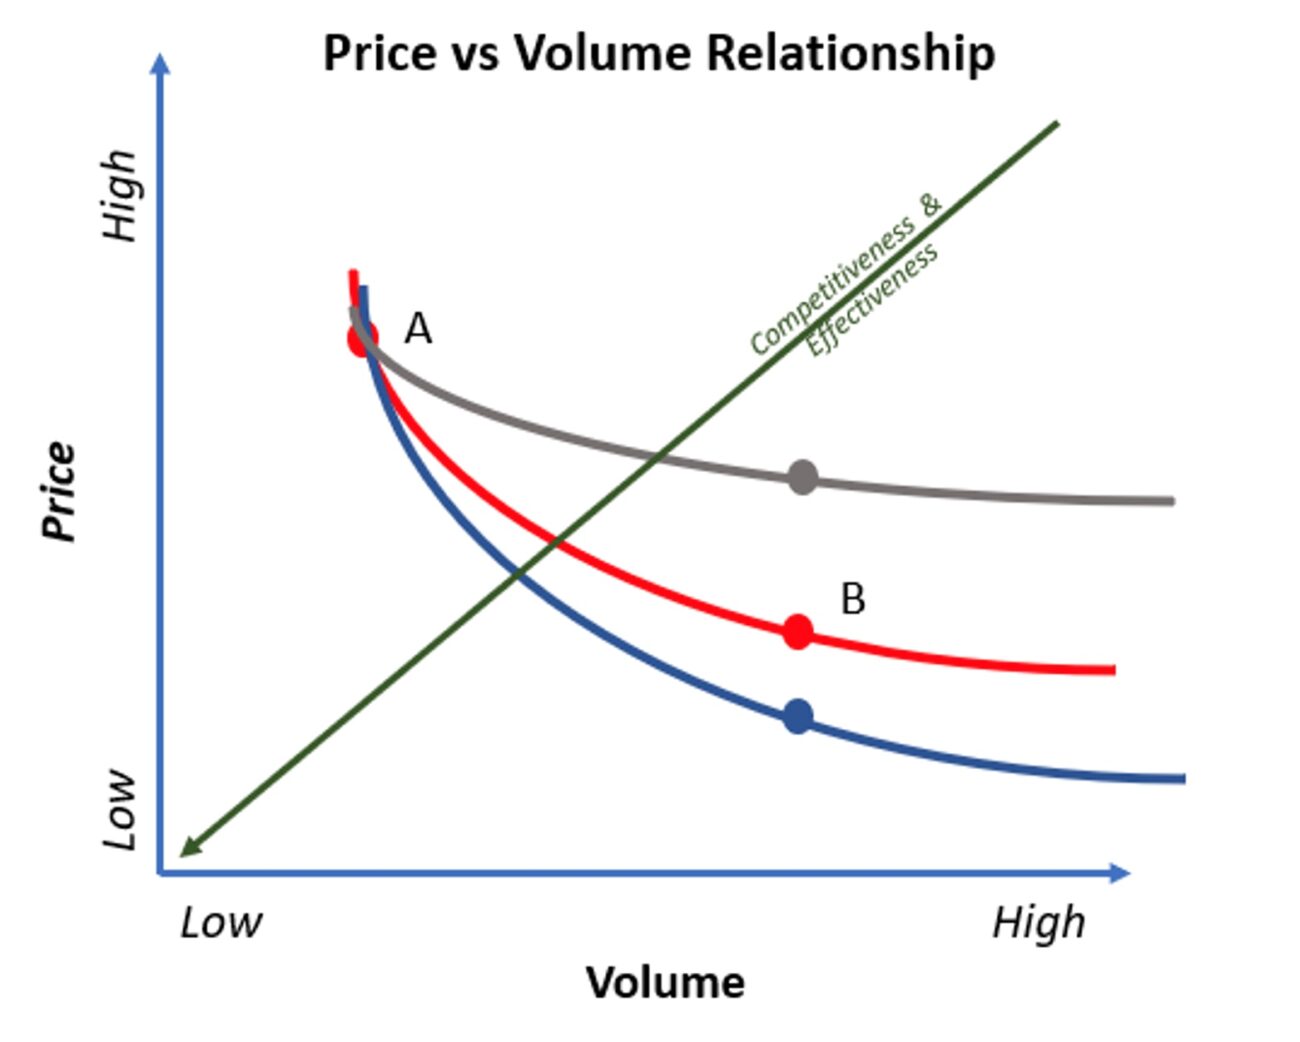 The graph points out a few interesting things. The first being the three companies with the same volume end up with different prices, which is interesting if the volume is the primary cost driver. The second is that the blue company gets more competitive pricing and is more effective in negotiations than the black one.
A Closer Look at Price
After removing the curved lines from the graph and adding real market price points, we better understand the lack of price vs. volume correlation. When thousands of price points are mapped together, the relationship between price and volume disappears as multiple prices vs. volume curves intertwine.
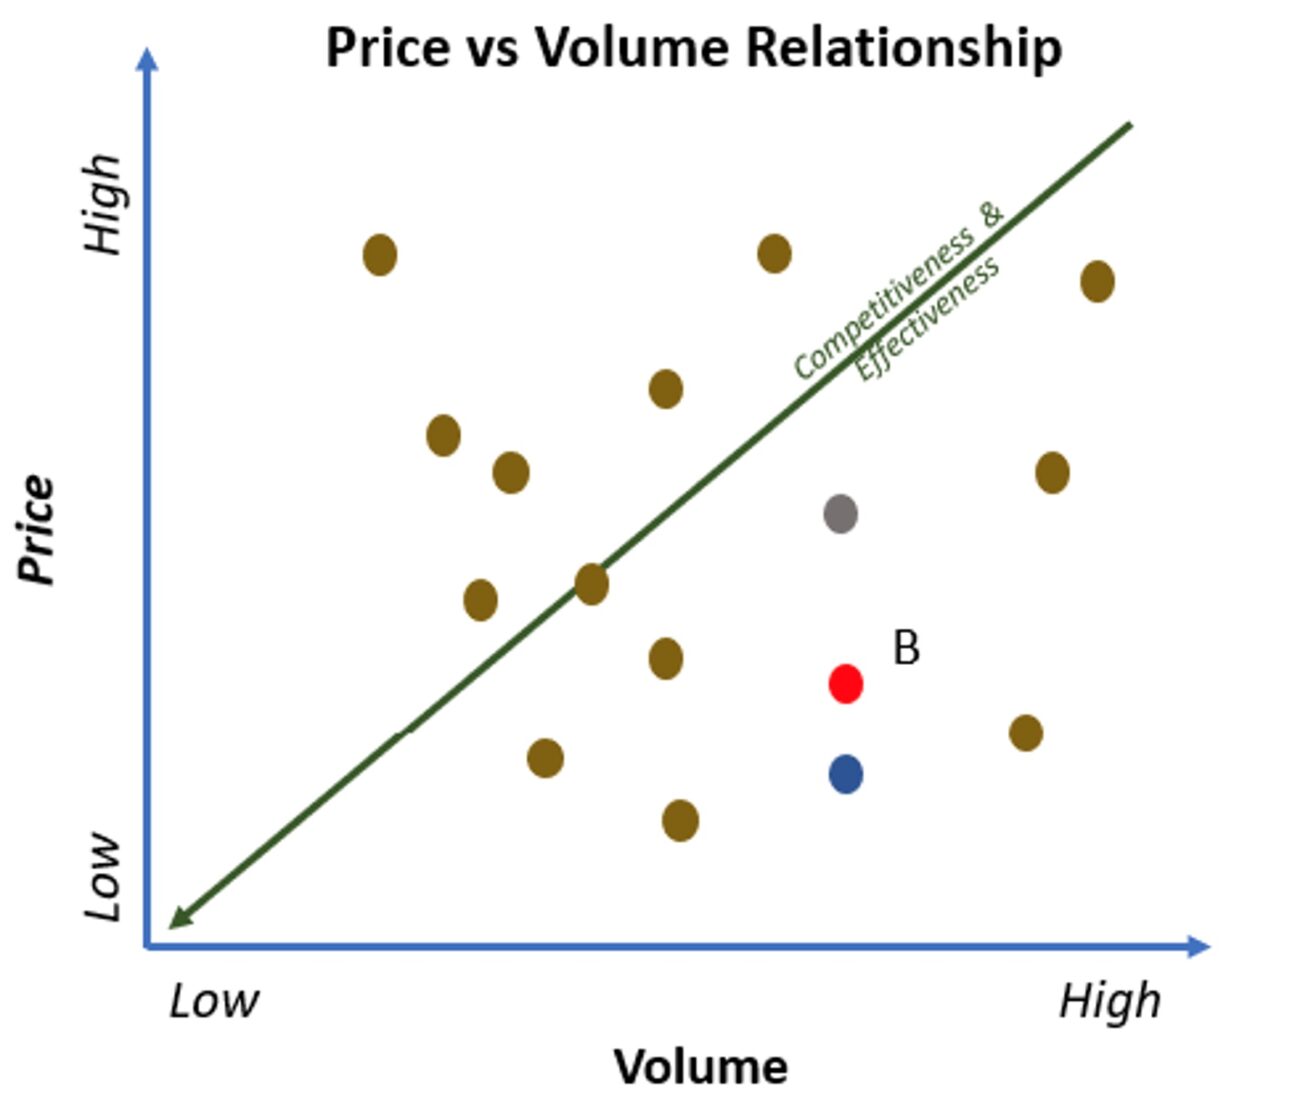 Many factors make up a component’s price equation, and volume is just one. At Lytica, we believe there are conservatively over 60 tangible and intangible factors that could fit into a price question and impact the pricing equation. Two significant factors include the following:
- Supply and demand set prices extremely high with little regard for volume considerations, as seen during the pandemic and subsequent shortage periods.
- Commitment counts! If the red company negotiates a multi-million-dollar deal at a price “B,” why should they go back to a high price result for different lower volume components?
Identifying Your Best Price
So, how does procurement know if they are getting a good price? Lytica’s Spend Benchmarking draws on the world’s largest and only independent database with millions of electronic components of actual prices paid by real customers. Companies can securely upload electronic component spend data to receive a comprehensive spend and risk analysis with negotiating advice at a part number level. This will provide you with competitiveness and negotiating effectiveness.


