
The Market Slows, Memory Surges, and the Helium Clock Is Ticking
Lytica is the world’s only provider of electronic component spend analytics and risk intelligence using real customer data. As a result of our unique position in the marketplace, we’ve been able to work with 100+ customers in analyzing over $550 billion in electronics spend. We curate up-to-date insights on the state of the electronic component market and share them here with you each month. Subscribe today to receive these each month upon release.
Lytica’s component basket comprises 165,000 electronic components across more than 30 categories, including the most popular devices used by our customers. These indices are intended to show market trends. Individual component and BOM analysis is offered by Lytica as a service to our customers.
The Market Slows — but Memory Is Rewriting the Rules
What is the overall electronic component price trend in April 2026?
The deceleration is real, but it is concentrated. Seven categories posted price decreases in April — Semiconductor (-.01%), Communication (–0.30%), Linear (–0.30%), Switch (–0.30%), RF/MW (–0.40%), Power Discrete (–0.60%), and Peripheral (–0.50%) — while Memory accelerated sharply to +9.50%, its highest monthly increase in the 2026 dataset. The overall index is being held down by modest declines in commodity-facing categories, while AI-critical components continue to inflate at a much faster pace.
The forces driving this divergence are structural, not cyclical:
- AI & Data Center Pull: Major cloud and AI companies — including Microsoft, Google, and Amazon — continue to drive unprecedented demand for high-speed AI memory chips, with no near-term signal of moderation. Demand for HBM and server DRAM continues to accelerate, pulling Memory pricing to new highs while leaving standard memory capacity constrained.
- Helium Supply Disruption: The closure of the Strait of Hormuz and damage to Qatar’s Ras Laffan LNG facility — the world’s largest source of the ultra-pure helium used in chip manufacturing — is now starting to affect factory output and component contract prices.
- Foundry Cost Pass-throughs: TSMC’s late-2025 pricing adjustments continue working through analog, mixed-signal, and logic categories.
- Raw Material Costs: Copper above $12,900 per metric tonne, lithium carbonate near $26,000, and elevated aluminum prices continue to press through wire, cable, magnetics, and power components.
⚠ Risk Alert: The helium supply constraint flagged in the March report is no longer a forward risk — it is an active one. Fab-level disruptions are beginning to materialize. Memory, advanced logic, and processor categories face the most immediate exposure. Teams managing memory-heavy or AI-accelerator BOMs should be acting now, not monitoring.
Monthly Price Change by Category
Which electronic component categories saw the largest price increases in April 2026
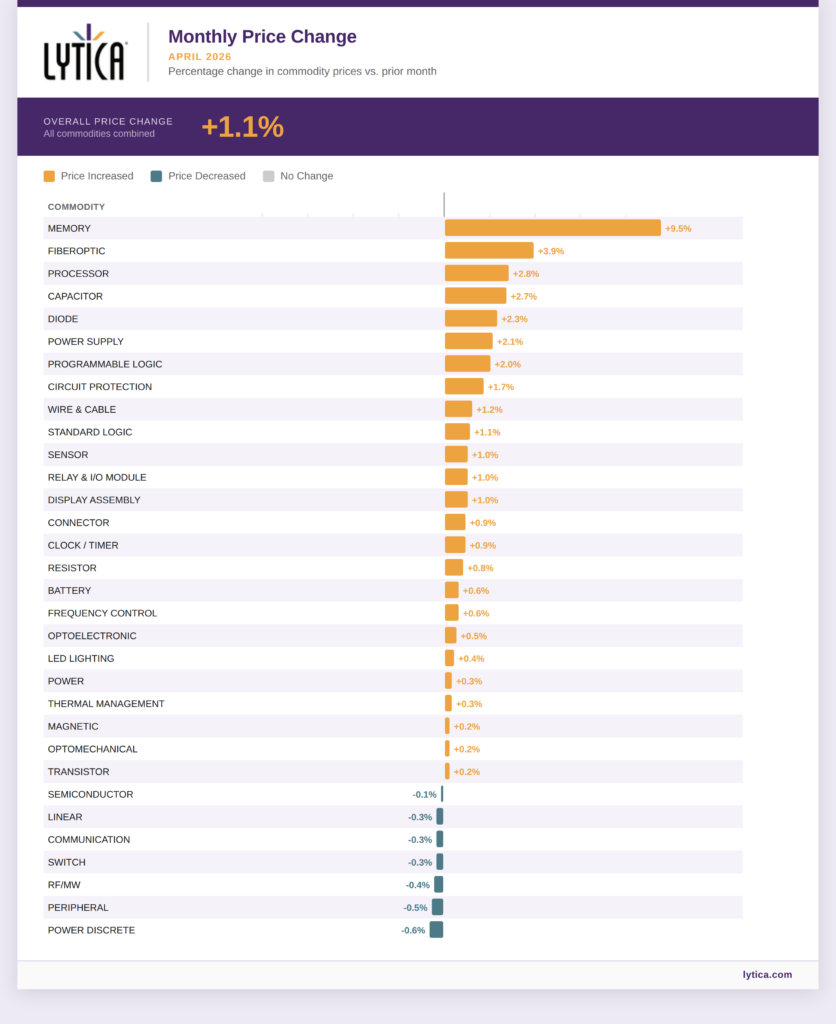
Figure 1: Monthly Price Change by Category — April 2026. Source: Lytica Electronic Components Data.
Memory (+9.50%) — Highest in the 2026 Dataset
Memory’s acceleration from +7.60% in March to +9.50% in April is the single most important data point in this month’s report. The helium supply disruption is beginning to constrain fab output for advanced DRAM processes, tightening an already undersupplied market. HBM capacity allocation continues to crowd out standard DRAM. TrendForce has revised DRAM contract prices upward to +90–95% QoQ, with NAND Flash at +55–60%. The April number reflects both the ongoing repricing wave and the first fab-level signals from the helium constraint. Teams with memory-heavy BOMs who have not locked in forward contracts are running out of runway.
🔑 Key Stat: Memory at +9.50% in April vs. +7.60% in March. This is the fastest monthly price increase across any category in the 2026 dataset to date.
Fiberoptic (+3.90%)
The largest mover outside Memory. Data center interconnect demand remains intense, and the category reached 100% stock availability in April — a signal of active procurement rather than stockpiling. Infrastructure buildout for AI and hyperscale data centers is the primary driver.
Processor (+2.80%)
Slightly down from March’s +3.60% but still firmly elevated. Hyperscalers continue pulling forward orders for inference and data center hardware. Advanced logic processes share the same helium supply exposure as Memory, and while the pricing transmission lag is longer, the direction of travel is clear. With the semiconductor industry on track to reach approximately $975 billion in revenue in 2026, suppliers here retain strong pricing power.
Power Supply (+2.10%), Capacitor (+2.70%), Diode (+2.30%)
Power Supply continues its structural inflation story — EV infrastructure, industrial automation, and AI data center power delivery all pulling in the same direction. Capacitor and Diode reflect steady end-market demand and upstream wafer cost pass-throughs. These are not reversal candidates in the near term.
Circuit Protection (+1.70%), Wire & Cable (+1.20%), Connector (+0.90%)
Copper above $12,900 per metric tonne remains the common thread. Circuit Protection and Wire & Cable have now posted consistent increases for four consecutive months with no sign of abating. Connector’s more modest increase follows March’s dramatic +170.73% lead-time spike. Watch whether that lead-time extension persists into May, as price follow-through remains likely.
Battery (+0.60%)
The modest April increase in Lytica’s basket significantly understates the raw material pressure facing the category. Lithium carbonate near $26,278 per metric tonne, nearly double year-earlier levels, combined with grid-scale storage demand, creates substantial pass-through pressure that is still working its way into finished component pricing.
📌 Watch List: Battery pricing in the Lytica basket (+0.60%) significantly lags raw material reality. Procurement teams should review battery component contracts now — particularly those up for renewal in Q3 or Q4. Locking in pricing before the pass-through completes is the lower-risk move. Do not use April’s +0.60% as a forward planning assumption for H2.
Categories Posting Declines
Seven categories recorded negative price changes in April: Semiconductor (-0.1%), Communication (–0.30%), Linear (–0.30%), Switch (–0.30%), RF/MW (–0.40%), Power Discrete (–0.60%), and Peripheral (–0.50%). These categories are concentrated in consumer-facing and more commoditized segments where demand has softened. The declines are modest and do not signal structural deflation — they reflect the two-speed market in which AI-critical components inflate rapidly while consumer-adjacent ones stabilize or ease slightly.
Monthly Price Change by Category
What is the trend in overall electronic component pricing through early 2026?
- January 2026: +2.00%
- February 2026: +2.00%
- March 2026: +2.30%
- April 2026: +1.10%
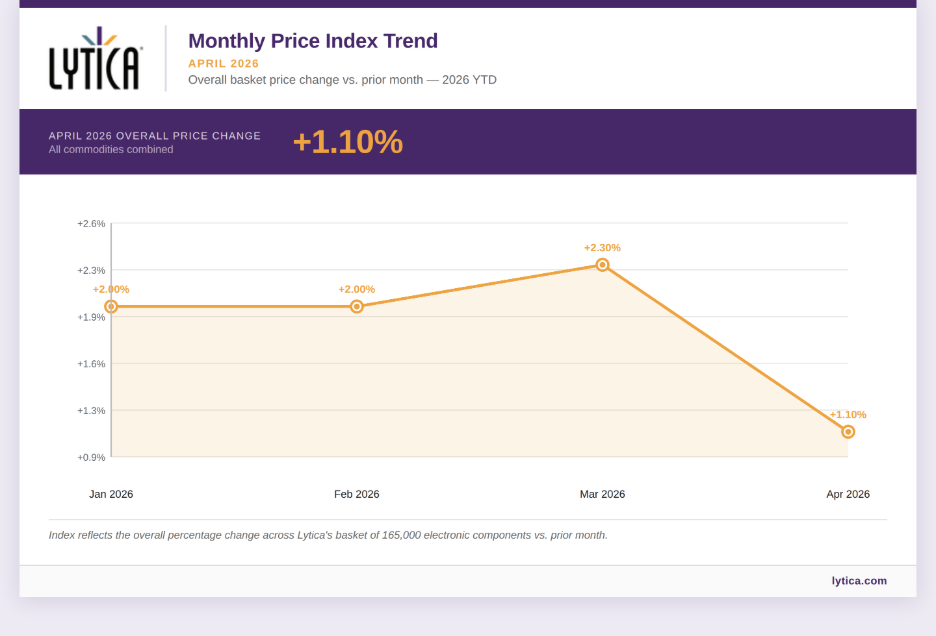
Figure 2: Monthly Price Index Trend — January to April 2026. Source: Source: Lytica Electronic Components Data.
Four months of data reveal a market that is not moving uniformly. The January–March pattern of steady, broad-based increases has broken in April, not because inflationary pressure is easing, but because it is concentrating. The gap between Memory’s +9.50% and Peripheral’s –0.50% is 10 percentage points — the widest spread in the 2026 dataset. Procurement teams whose BOMs skew toward AI and data center components are experiencing a fundamentally different cost environment than those in consumer or industrial segments.
The headline index of +1.10% should not be used as a forward planning assumption. The helium supply disruption has not yet fully registered in April contract pricing. The May report will reflect that impact more directly.
Monthly Lead Time Change
Are electronic component lead times improving or worsening in April 2026?
April saw a broad reversal of March’s dramatic lead time spike, with the overall lead time index falling to –4.42% from March’s +23.71%. The compression was widespread: 22 of 33 categories posted lead time decreases in April. This is consistent with the procurement front-loading that drove March’s spike — teams pulled orders forward ahead of anticipated Q2 price increases, temporarily extending lead times, and April reflects the normalization that follows.
The largest lead time compressions in April came from Connector (–24.98%) and Frequency Control (–24.09%) — both of which had spiked sharply in March — along with Processor (–21.12%), Resistor (–19.16%), and Capacitor (–15.77%).
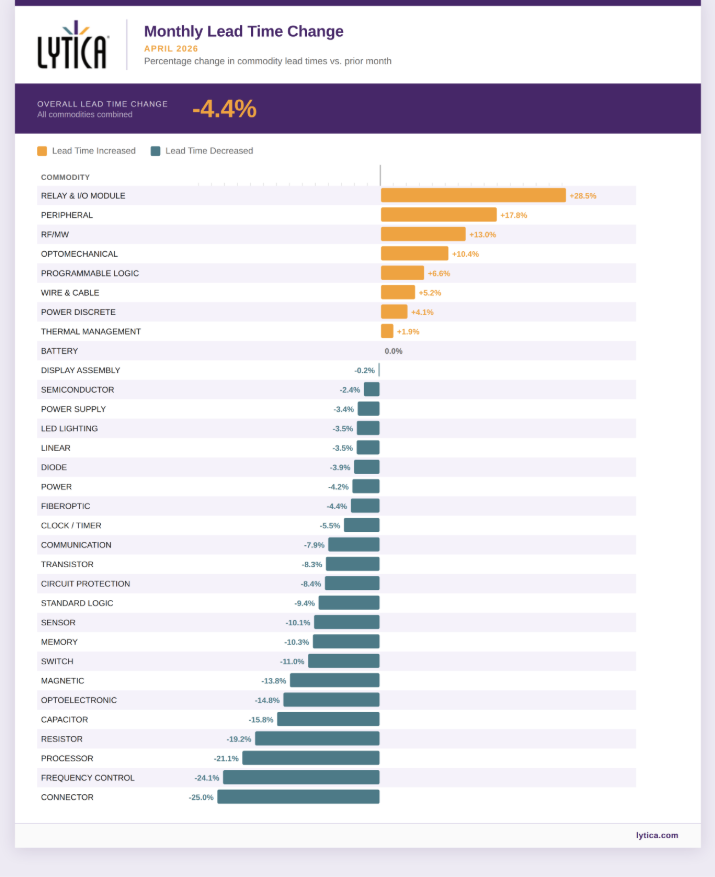
Figure 3: Monthly Lead Time Change by Category — April 2026. Source: Lytica Electronic Components Data.
⚠️ Risk Alert: Not all categories compressed. Relay & I/O Module lead times extended further in April (+28.48%) after a +89.45% spike in March. Optomechanical (+10.38%), RF/MW (+13.03%), Peripheral (+17.83%), and Programmable Logic (+6.64%) also posted increases. In categories where both lead times and prices are moving up simultaneously, supply constraint is real and deepening.
What does the lead time trend mean for Q2 2026 procurement planning?
The lead time compression in most categories through April is not a signal of improving supply conditions in high-demand segments; it is a normalization from March’s front-loaded spike. Categories directly exposed to helium supply constraints (Memory, advanced logic, Processor) have seen lead time decreases in April, but those decreases reflect contract timing rather than supply abundance. As fab-level constraints from the helium shortage materialize over the next 30–60 days, lead time extensions in these categories are likely to follow.
Monthly Lead Time Index Trend
How have lead times trended across 2026 to date?
- January 2026: -0.90%
- February 2026: -3.53%
- March 2026: +23.71%
- April 2026: -4.42%
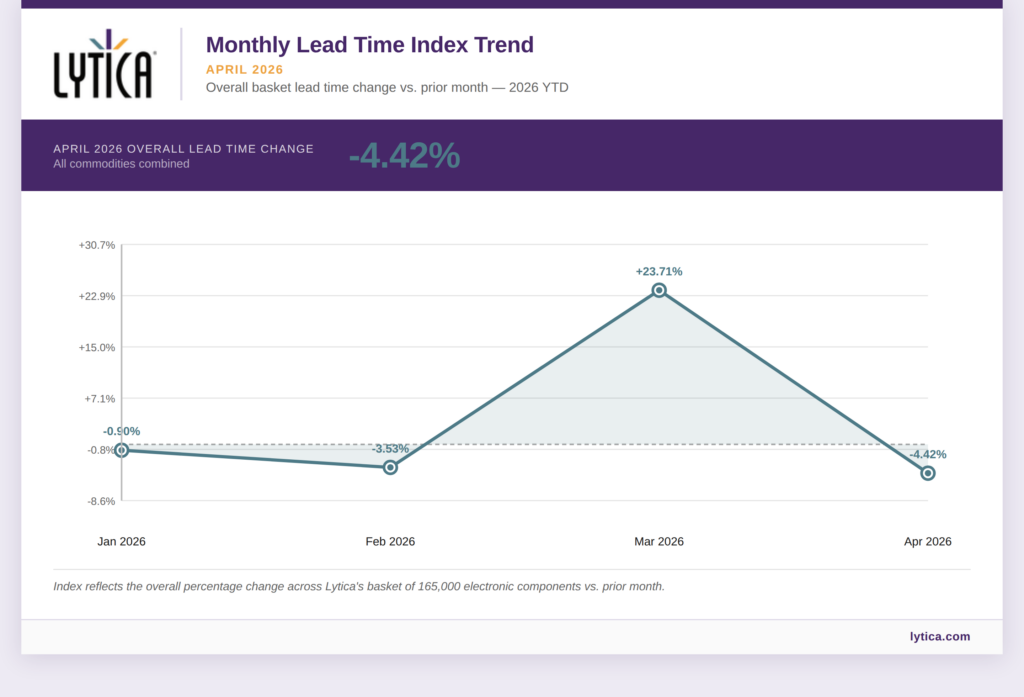
Figure 4: Monthly Lead Time Index Trend — January to April 2026. Source: Lytica Electronic Components Data.
The swing from broad compression (Jan/Feb) to extreme extension (March) to normalization (April) over four months reinforces the point that lead time data must be read in context. February’s broad compression was a genuine positive signal. March’s spike was concentrated in categories that had the most acute February compressions. April’s reversal is consistent with short-cycle inventory dynamics following that front-loading episode.
The pattern is not structural deterioration yet. But the lead time extensions for the Relay & I/O Module, Peripheral, and RF/MW should be closely monitored over the next 30–60 days. If they persist, pricing follow-through in these categories is likely.
Stock Availability
What is the current stock availability for electronic components?
Overall stock availability moved to 92% in April, up marginally from 91% in March, indicating that the broad supply picture remains healthy at the basket level. Three categories reached 100% availability: Fiberoptic, Power, and Linear.
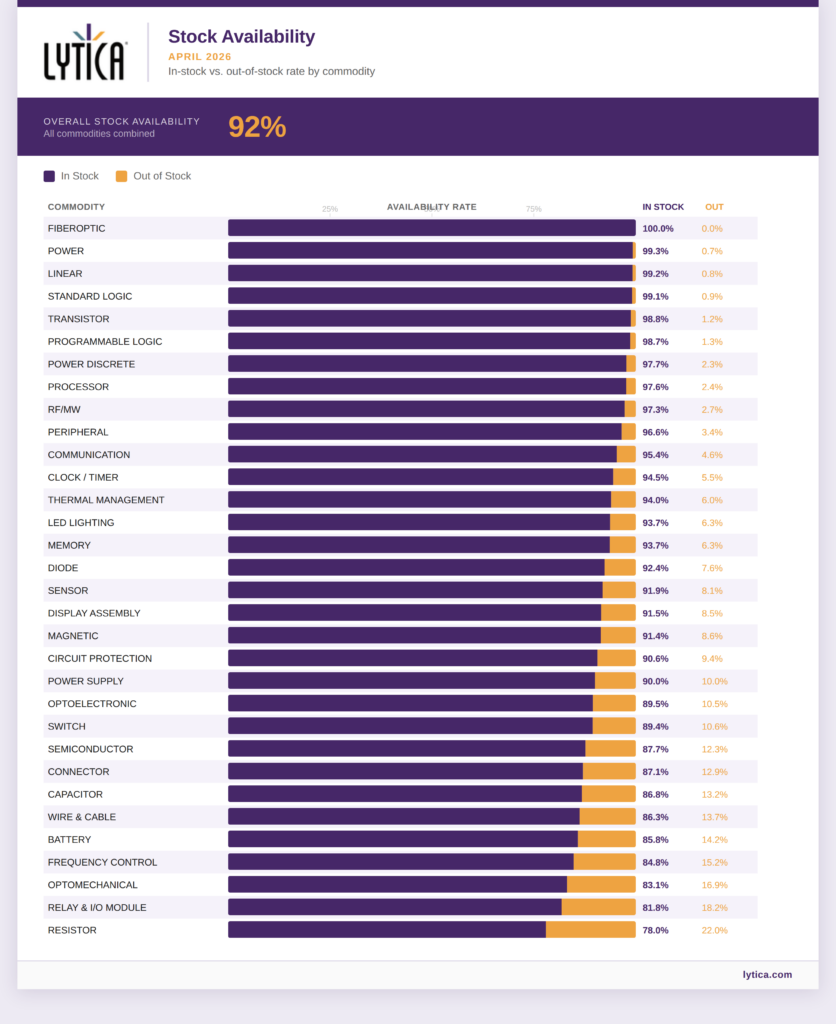
Figure 5: Monthly Stock Availability by Category — April 2026. Source: Lytica Electronic Components Data.
The tightest availability categories in April are: Resistor (77.98%), Optomechanical (83.13%), Frequency Control (84.79%), Battery (85.81%), and Capacitor (86.80%). Relay & I/O Module remains tight at 81.84%, consistent with its continued lead time extension.
Memory availability at 93.66% remains below some other categories despite the highest price increases in the basket — reinforcing the established interpretation that Memory inflation is supplier-driven repricing and capacity reallocation toward HBM, not an outright shortage scenario at current demand levels. That assessment may be revised as helium constraints tighten fab output in May.
📌 Key Insight: The overall picture — 92% basket availability with no categories in acute shortage, continues to support the interpretation that this is a cost-driven inflation cycle. Suppliers are raising prices because they can. That assessment holds for April. Whether it holds for May depends on the pace of helium-driven fab output constraints, which will be addressed in full in the May report. Subscribe now to ensure you don’t miss it!
Looking Ahead: Key Takeaways for Procurement Teams
What should procurement teams prioritize based on the April 2026 component market data?
The April data marks a transition point. The March narrative, broad-based increases, stable lead times, and healthy availability, has given way to a more complex picture in April. The deceleration in the headline index is real but misleading; underlying inflation in AI-critical components is accelerating, and the helium supply disruption is shifting from a forward risk to an active constraint.
Specific priorities for procurement teams entering May include:
- Memory & HBM — At +9.50% and still accelerating, Memory is in a different pricing environment than the rest of the basket. Teams without forward contracts should treat locking in supply as urgent, not discretionary. The helium constraint affecting advanced DRAM fab processes will not resolve quickly.
- Relay & I/O Module — Lead times extended in both March and April. With availability at 81.84% and pricing up +1.00% in April, this category is showing the classic pre-squeeze pattern. Monitor closely over the next 30 days.
- Advanced Logic & Processors — The helium supply exposure is real for sub-5nm processes. Processor pricing at +2.80% in April; the transmission lag between fab constraints and contract pricing is typically 6–10 weeks. Q3 exposure is building.
- Wire & Cable, Magnetics, Connectors — Copper at $12,900+ per metric tonne continues to press through these categories. Four consecutive months of increases with no moderation signal. Include in Q3 budget revisions.
- Battery — The gap between raw material costs (lithium at ~$26,000/tonne) and basket pricing (+0.60% in April) will close. Build this into H2 cost models now.
⚠️ Forward Planning Note: Do not use April’s +1.10% headline as a Q2 or Q3 planning assumption. The helium supply chain disruption has not yet fully registered in contract pricing. The May report will be the first full accounting of that impact. Subscribe now to ensure you receive it upon release.
To receive the Monthly State of the Market Report directly to your inbox subscribe here.
Sources and References
The following sources were consulted in preparing this report to provide broader market context, pricing data, and geopolitical analysis, alongside Lytica’s proprietary component basket data.
Bloomberg, “Iran Strike Damages 17% of Qatar LNG for 3–5 Years,” March 19, 2026. https://www.bloomberg.com/news/articles/2026-03-19/iran-strike-damages-17-of-qatar-lng-for-3-5-years-reuters-says
Carbon Credits, “Lithium Prices Climb Again in 2026,” March 2026. https://carboncredits.com/lithium-prices-climb-again-in-2026-sending-stocks-skyward-nili/
CBS News, “It’s not just oil — the Iran war is disrupting helium and aluminum supplies,” March 2026. https://www.cbsnews.com/news/iran-war-helium-aluminum-shortage-impact/
CNBC, “QatarEnergy halts LNG production after Iran drone attacks,” March 2, 2026. https://www.cnbc.com/2026/03/02/qatars-state-owned-energy-company-halts-lng-production-after-iran-drone-attacks.html
CNBC, “Iran missile attack causes extensive damage to Qatar’s Ras Laffan facility,” March 18, 2026. https://www.cnbc.com/2026/03/18/iran-war-qatar-ras-laffan-natural-gas-lng.html
Counterpoint Research, “Memory Prices Surge Up to 90% From Q4 2025,” February 5, 2026. https://counterpointresearch.com/en/insights/Memory-Prices-Surge-Up-to-90-From-Q4-2025
Credendo, “Lithium, Cobalt, Nickel and Copper Market Update,” February 12, 2026. https://credendo.com/en/knowledge-hub/lithium-cobalt-nickel-and-copper-market-update-volatility-supply-risks-and-diverging
Deloitte Insights, “2026 Semiconductor Industry Outlook,” February 11, 2026. https://www.deloitte.com/us/en/insights/industry/technology/technology-media-telecom-outlooks/semiconductor-industry-outlook.html
Digitimes, “Strait of Hormuz disruption puts semiconductor supply chains at risk,” March 2026. https://www.digitimes.com/news/a20260424VL214/euv-photoresist-materials-middle-east-disruption-2026.html
Forex.com, “Trade to watch 2026: Copper’s time to shine?,” February 3, 2026. https://www.forex.com/en-us/news-and-analysis/trade-to-watch-2026-copper-s-time-to-shine/
J2 Sourcing, “The Global Helium Crisis: What It Means for Semiconductor Manufacturing,” March 2026. https://j2sourcing.com/blog/helium-crisis-semiconductor-manufacturing-electronic-components-2026/
Omdia / Informa TechTarget, “SemiDynamics 2026 Q1 Report,” March 2026. https://omdia.tech.informa.com/
Reuters, “Helium Shortage Has Started Impacting Tech Supply Chains, Execs Say,” March 26, 2026. https://money.usnews.com/investing/news/articles/2026-03-26/helium-shortage-has-started-impacting-tech-supply-chains-execs-say
SoftwareSeni, “DRAM Prices in 2026 Have Doubled,” March 2026. https://www.softwareseni.com/dram-prices-in-2026-have-doubled-and-the-numbers-are-getting-worse/
Sourceability, “2026 Semiconductor Industry Outlook + M&A,” 2026. https://sourceability.com/post/semiconductor-industry-outlook-for-2026-shows-rebound-amid-mergers
Sourceability, “Tracking Memory Price Increases Across the Last Several Quarters,” March 2026. https://sourceability.com/post/tracking-memory-price-increases-across-the-last-several-quarters
StartUs Insights, “Semiconductor Industry Outlook 2026: Snapshot,” February 9, 2026. https://www.startus-insights.com/innovators-guide/semiconductor-industry-outlook-key-insights/
TechInsights, “McClean Report February 2026: Q1 Semiconductor Market Forecast Update,” February 2026. https://www.techinsights.com/blog/mcclean-report-february-2026-q1-semiconductor-market-forecast-update
Tom’s Hardware, “The global helium shortage is a direct threat to the chipmaking supply chain,” March 2026. https://www.tomshardware.com/tech-industry/semiconductors/the-global-helium-shortage-is-a-direct-threat-to-chipmaking
Trading Economics, “Copper — Price — Chart — Historical Data,” February 2026. https://tradingeconomics.com/commodity/copper
TrendForce, “Memory Price Outlook for 1Q26 Sharply Upgraded,” February 2, 2026. https://www.trendforce.com/presscenter/news/20260202-12911.html
WCCFTech, “Memory & NAND Prices Surged Over 90% In Q1 2026,” February 9, 2026. https://wccftech.com/memory-nand-prices-surged-90-percent-in-q1-2026/
To receive the Monthly State of the Market Report directly to your inbox subscribe here.