Electronics Market Shows Very Modest Optimism for Buyers
Lytica is the world’s only provider of electronic component spend analytics and risk intelligence using actual customer data. As a result of our unique position in the marketplace, we’ve been able to work with 100+ customers in analyzing over $425 billion in electronics spend. We’ve curated up-to-date insights on the state of the electronic component market and will be sharing them with you each month.
Lytica’s component basket of goods used in our analysis is comprised of 15,800 electronic components across more than 30 categories, consisting of the most popular devices used by our customers. These indices are intended to show trends in the market. Individual component and BoM analysis is offered by Lytica as a service to our customers.
Electronic Component Pricing Once Again on Downward Trend
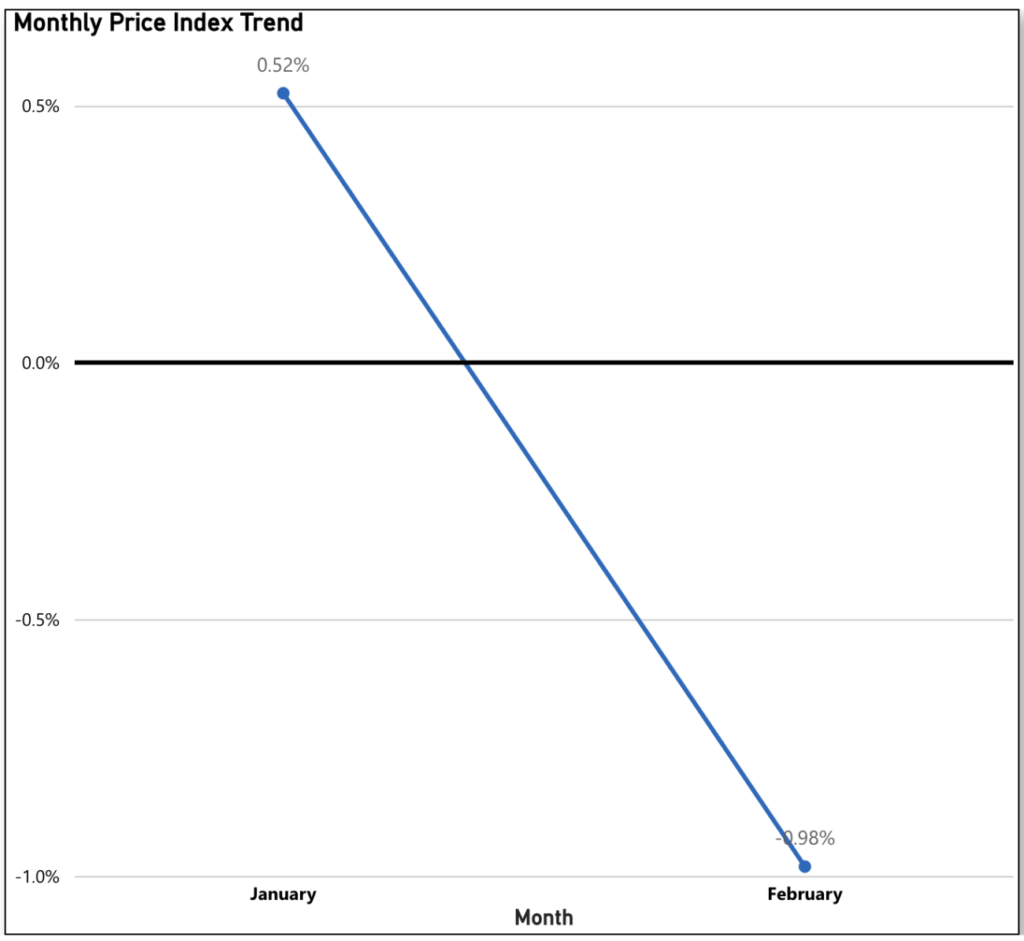
February brings a resurgence of optimism for buyers worldwide, following a sluggish beginning to the year in terms of pricing. Compared to January’s initial uptick of 0.52%, February witnessed a modest price decrease of 0.98% Month-to-Month. This continues the favorable trajectory for buyers, with prices having decreased in 10 out of the last 14 months since January 2023.
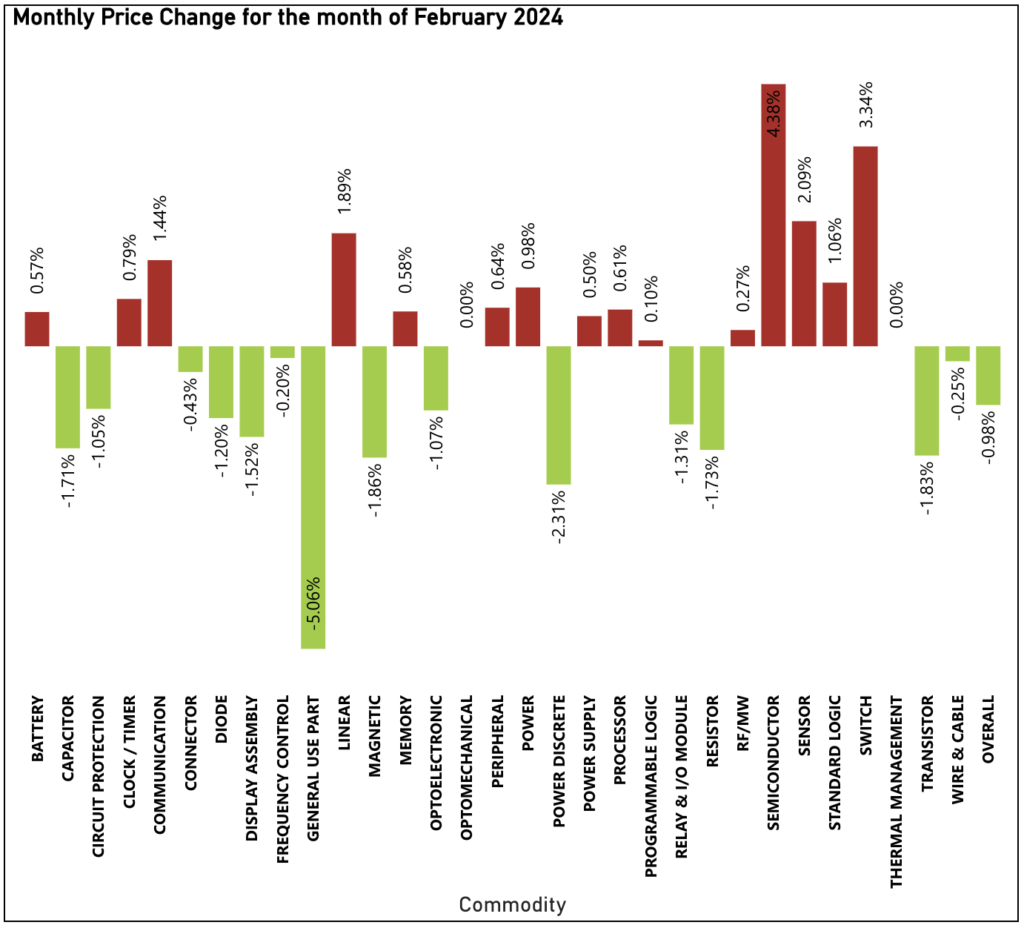
The biggest drivers in this pricing readout include General Use Parts (down 5.06% Month-to-Month, following a 0.21% decrease in January), Power Discrete (down 2.31% Month-to-Month), and Magnetic (down 1.86% Month-to-Month).
The commodities pushing upward against this trend include Semiconductor (up 4.38% Month-to-Month, following a previous decrease of 0.87%), Switch (up 3.34% Month-to-Month following a previous increase of 0.93% Month-to-Month) and Sensor (up 2.09% Month-to-Month following a previous decrease of 1.88% Month-to-Month), among others.
Could Large Lead Time Decreases Be Coming to an End?
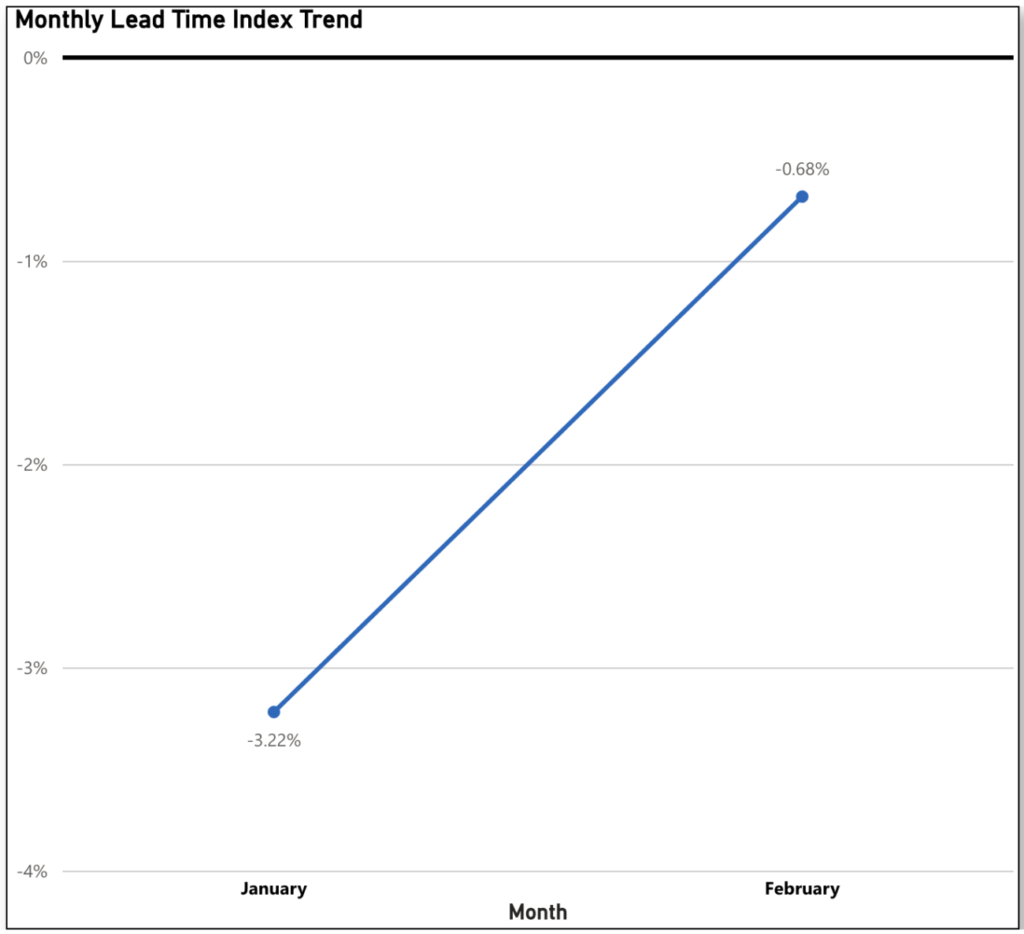
The trend of decreasing lead times continues into February, surely being welcome news for buyers. However, the average lead time only decreased by a modest 0.68% Month-to-Month. Even though this aligns with the overarching pattern observed over 2023, it is not consistent with the size of decreases observed. The 2023 State of the Electronic Market Report Round Up highlighted consistently larger month-to-month decreases in lead times for 2023. Could February be signifying the onset of lead times finally stabilizing?
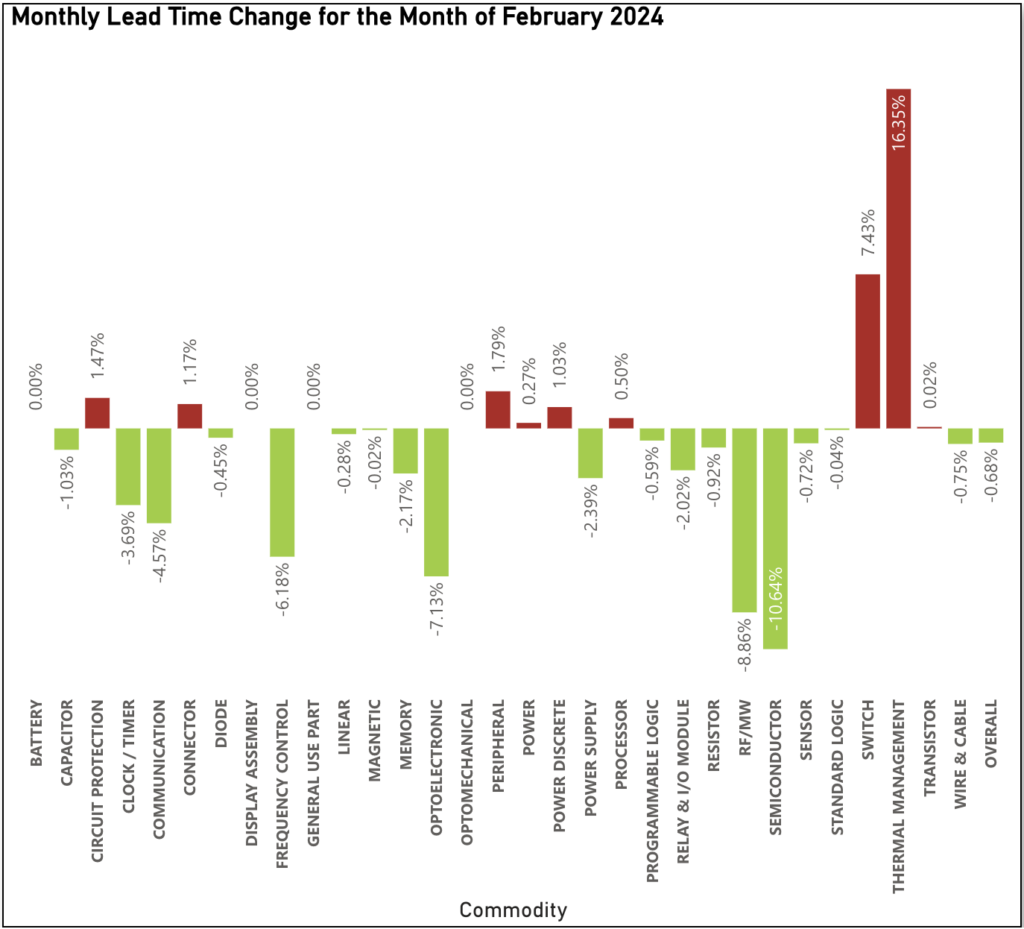
The decrease in lead times was driven largely by Semiconductor (down 10.64% Month-to-Month), RF/MW (down 8.86% Month-to-Month) Optoelectronic (down 7.13% Month-to-Month), and Frequency Control (down 6.18% Month-to-Month).
Those commodities pushing back on February’s trend included mainly Thermal Management (up 16.35% Month-to-Month), and Switch (up 7.43% Month-to-Month).
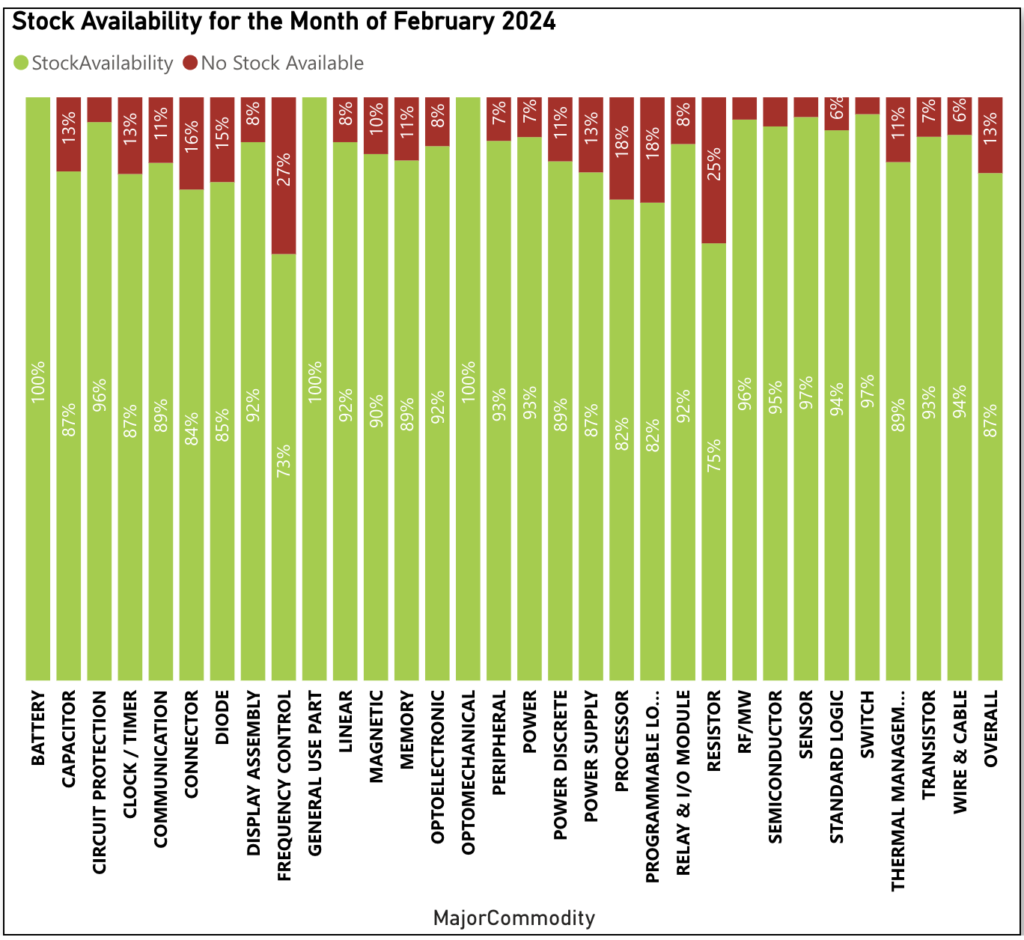
Electronic Component Availability Remains Consistent for February
In February, electronic component availability was at 87% on average, with no change from the 87% of all tracked electronic components available in January 2024. Although there is no change, stock availability is still higher on average than the 82% availability in 2023. Those components leading the way from an availability perspective in February included Battery, General Use Parts and Optomechanical (all at 100% Available), and Sensor and Switch (both at 97% Available).
Sign up for our newsletter for more on the electronic components market. Also make sure to check out our 2023 State of the Electronic Component Market Round Up if you haven’t already.