Electronics Market Sees Slight Decline to Kick off 2024
Lytica is the world’s only provider of electronic component spend analytics and risk intelligence using actual customer data. As a result of our unique position in the marketplace, we’ve been able to work with 100+ customers in analyzing over $425 billion in electronics spend. We’ve curated up-to-date insights on the state of the electronic component market and will be sharing them with you each month.
Lytica’s component basket of goods used in our analysis is comprised of 15,800 electronic components across more than 30 categories, consisting of the most popular devices used by our customers. These indices are intended to show trends in the market. Individual component and BoM analysis is offered by Lytica as a service to our customers.
Electronic Component Pricing Starts off 2024 with Slight Increase
To start off the new year, electronic components pricing saw a 0.52% increase in pricing over the month. This is after a year of favorable pricing for buyers in 2023, which saw the December year to date price of tracked components down 8.99%. January’s pricing readout marks the first month of pricing increases since November 2023’s increase of 0.20%, and only the fourth increase since January 2023. Electronic pricing continues to be compelling for procurement teams to start off 2024.
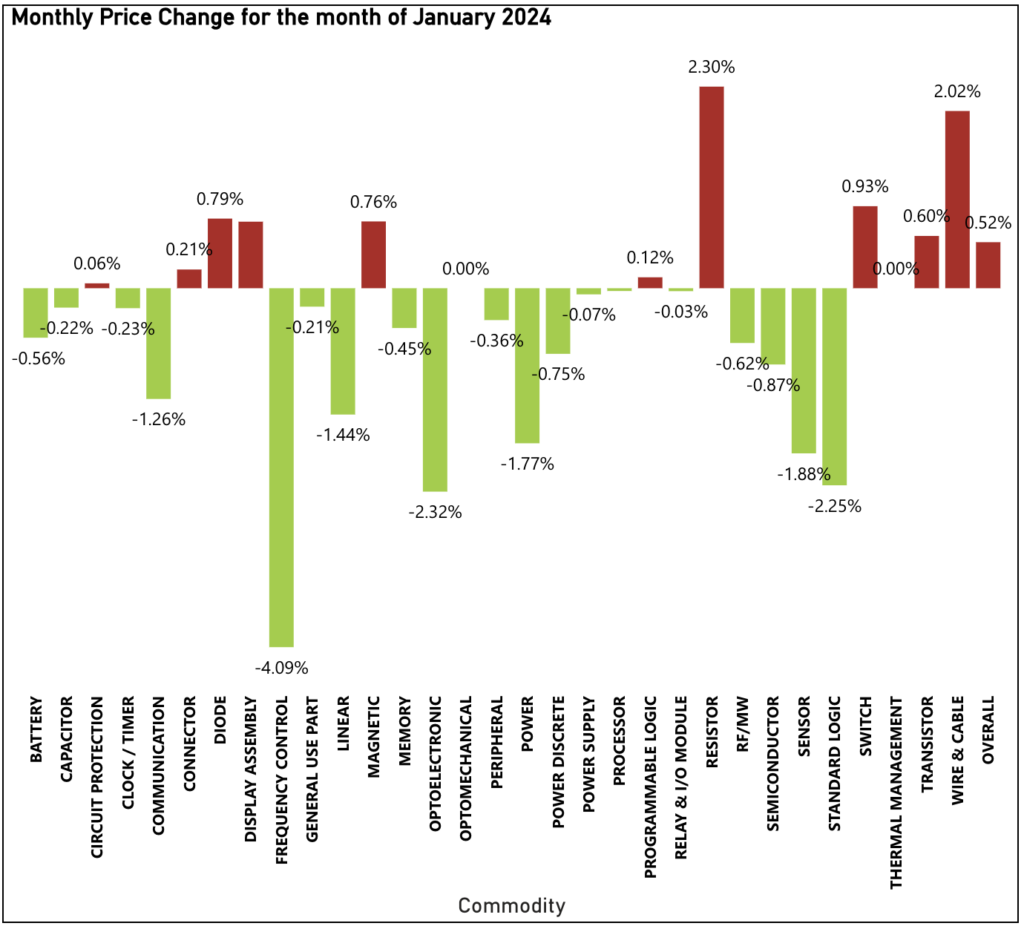
The biggest drivers in this pricing readout include Resister (up 2.30% Month-to-Month, following a 0.4% increase in December), Wire and Cable (up 2.02% Month-to-Month), and Switch (up 0.93% Month-to-Month).
The commodities pushing downward against this trend include Frequency Control (down 4.09% Month-to-Month), Optoelectronic (down 2.32% Month-to-Month following a previous decrease of 0.4% Month-to-Month) and Standard Logic (down 2.25% Month-to-Month following a previous decrease of 2.0% Month-to-Month), among others.
Electronic Component Lead Times Continue Positive Trend for Buyers
The trend for decreasing lead time continues in 2024, which is great news for buyers. January’s average lead time decreased by 3.22% month-to-month. This maintains the pattern observed over the past year of decreasing lead times for tracked components, with the only exception being a 1.2% increase in October 2023.
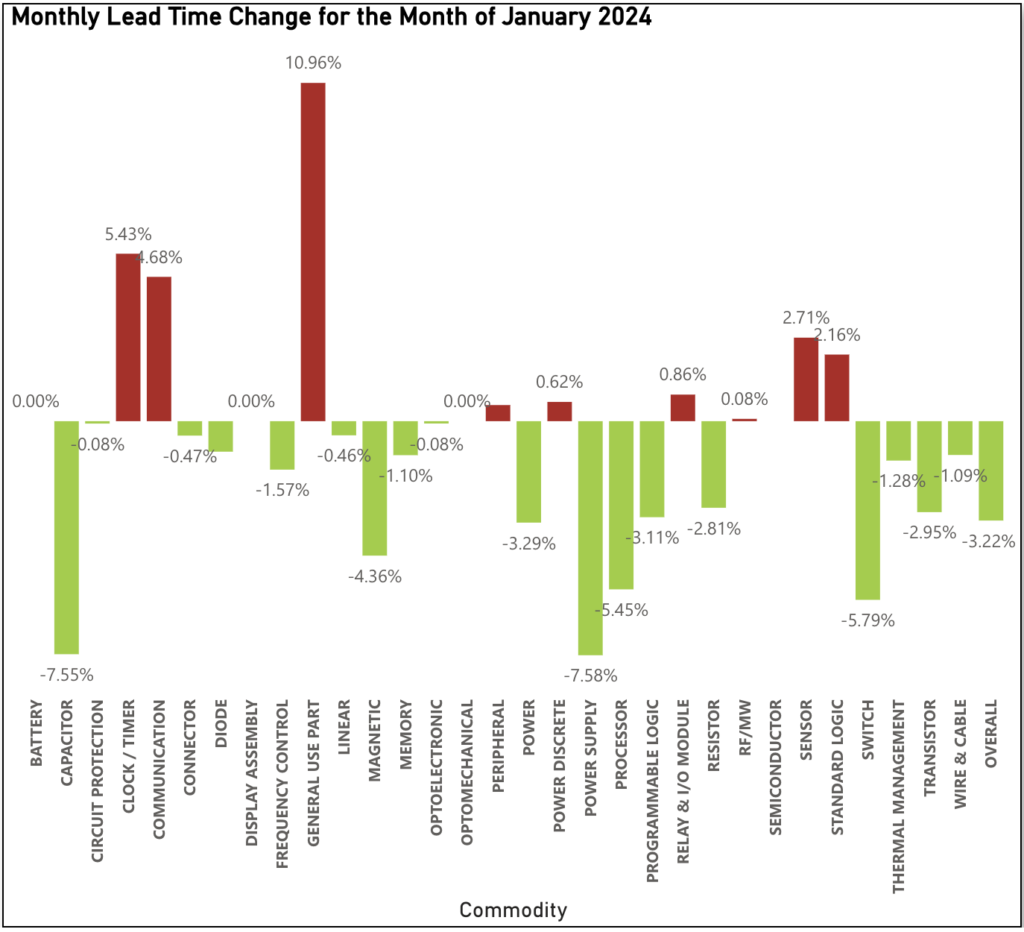
The decrease in lead times was driven largely by Power Supply (down 7.58% Month-to-Month), Capacitor (down 7.55% Month-to-Month) and Switch (down 5.79% Month-to-Month).
Those commodities pushing back on January’s trend included General Use Parts (up 10.96% Month-to-Month), Clock/Timer (up 5.43% Month-to-Month), and Communication (up 4.68% Month-to-Month).
Electronic Component Availability Sees Small Dip In January
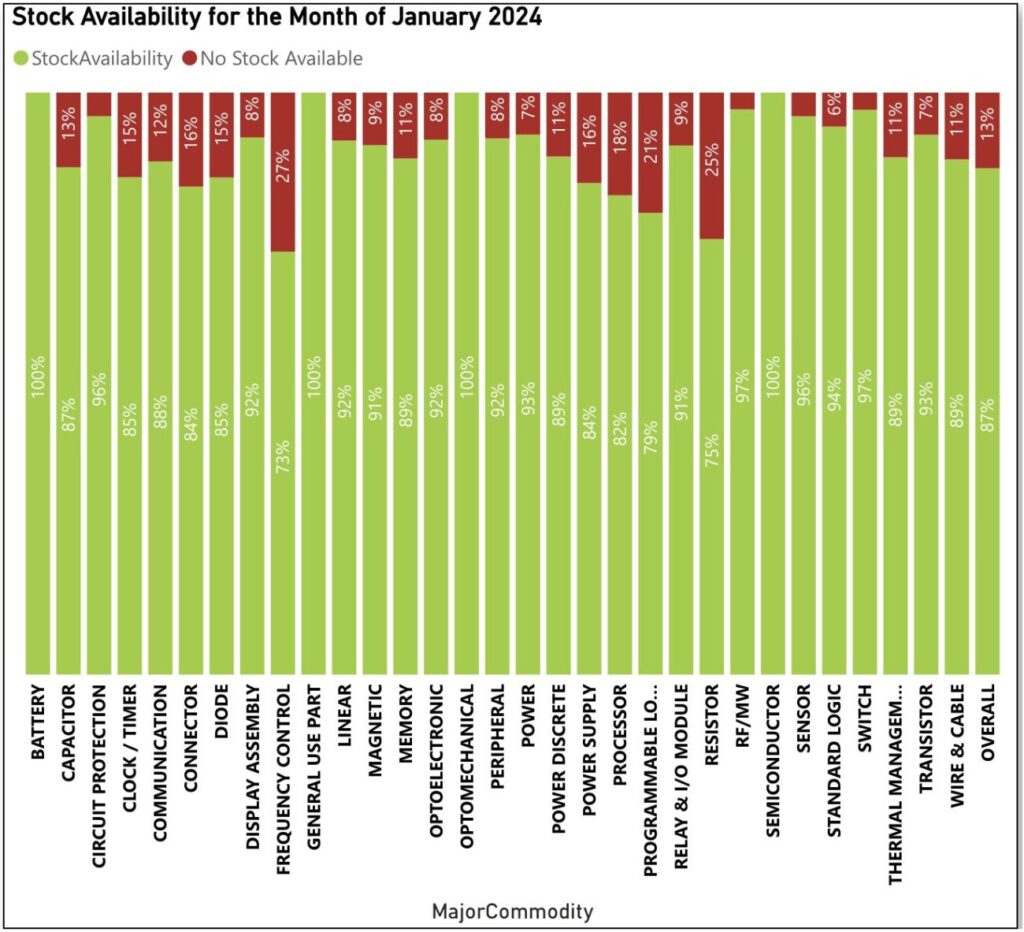
In January, electronic components were 87% available on average, a drop from 89% of all tracked electronic components available in December 2023. Although a small decrease, stock availability is still higher than 10 months in 2023. Those components leading the way from an availability perspective in January included Battery, General Use Parts, Optomechanical, and Semiconductors (all at 100% Available), and RF/MW and Switch (both at 97% Available).
Sign up for our newsletter for more on the electronic components market. Also make sure to check out our 2023 State of the Electronic Component Market Round Up if you haven’t already.