Price Inflation Cools, but Analog and Power Lead Times Flash a New Warning
Lytica is the world’s only buyer-powered agentic AI supply chain platform, built on real customer transactional data. The SupplyLens™ Pro platform gives procurement teams the clarity and leverage to cut costs in negotiations, reduce supply risk, and make good decisions from design to source. The world’s top OEMs and EMS providers tell us the same thing: before Lytica, they were operating in the dark.
As a result of this unique position in the marketplace, we’ve been able to work with hundreds of customers in analyzing over $550+ billion in electronics spend. We’ve curated up-to-date insights on the state of the electronic component market and will be sharing them with you each month here. Subscribe today to receive these each month upon release.
Lytica’s component basket of goods used in our analysis is comprised of 165,000 electronic components across more than 30 categories, consisting of the most popular devices used by our customers. These indices are intended to show trends in the market. Individual component and BoM analysis is offered by Lytica as a service to our customers. Request a demo to see it in action.
⚡ Key Takeaway Summary
July brought some relief at the headline level, but the underlying component market remains far from settled. The overall electronic component price index increased +1.09% month over month in July, down from +1.38% in June and +1.49% in May. Several component categories saw month-over-month price declines again: five categories fell and three were flat.
At the same time, the overall lead time index remained elevated at +4.89%. Pressure rotated into a new group of categories: Linear (+22.1%), Communication (+19.5%), Power (+18.9%), and Standard Logic (+18.6%).
The most important July divergence is that these categories still show very high stock availability. Communication is at 99.0%, Power at 98.7%, Standard Logic at 97.7%, and Linear at 97.0%. The immediate issue is not widespread stock depletion. It is delivery-window expansion despite available inventory – a signal procurement teams should watch closely for future pricing pressure.
Meanwhile, Memory (+4.8%) and Capacitor (+4.5%) led July price increases. External market data reinforce both trends: memory supply remains tight as capacity prioritizes AI and server applications, while high-end MLCC demand is lifting supplier book-to-bill ratios and increasing shortage risk.
Battery, June’s biggest warning, moved in the opposite direction in July: prices fell -1.7%, lead times increased only +0.5%, and availability improved to 86.1%. Softer lithium salt and spodumene prices during July support the near-term easing in battery cost pressure.
Action required: Prioritize Linear, Communication, Power, Standard Logic, and Frequency Control for Q3/Q4 supply reviews. Maintain forward coverage on Memory and Capacitor. Battery risk can move from urgent escalation back to active monitoring unless individual MPN exposure says otherwise.
What Drove Electronic Component Price Changes in July 2026?
July marked a clear change from June’s nearly universal inflation. The overall price index slowed, and several component categories saw month-over-month price declines again. Battery (-1.7%), Display Assembly (-0.5%), Optoelectronic (-0.4%), RF/MW (-0.3%), and Transistor (-0.04%) moved lower.
- Overall basket price index: +1.09% MoM, down from +1.38% in June
- Highest increase: Memory +4.8%
- Second-highest: Capacitor +4.5%
- Categories at or above +2.0%: Memory, Capacitor, Linear, Frequency Control, and Connector
- Five categories declined; Circuit Protection, LED Lighting, and Switch were flat
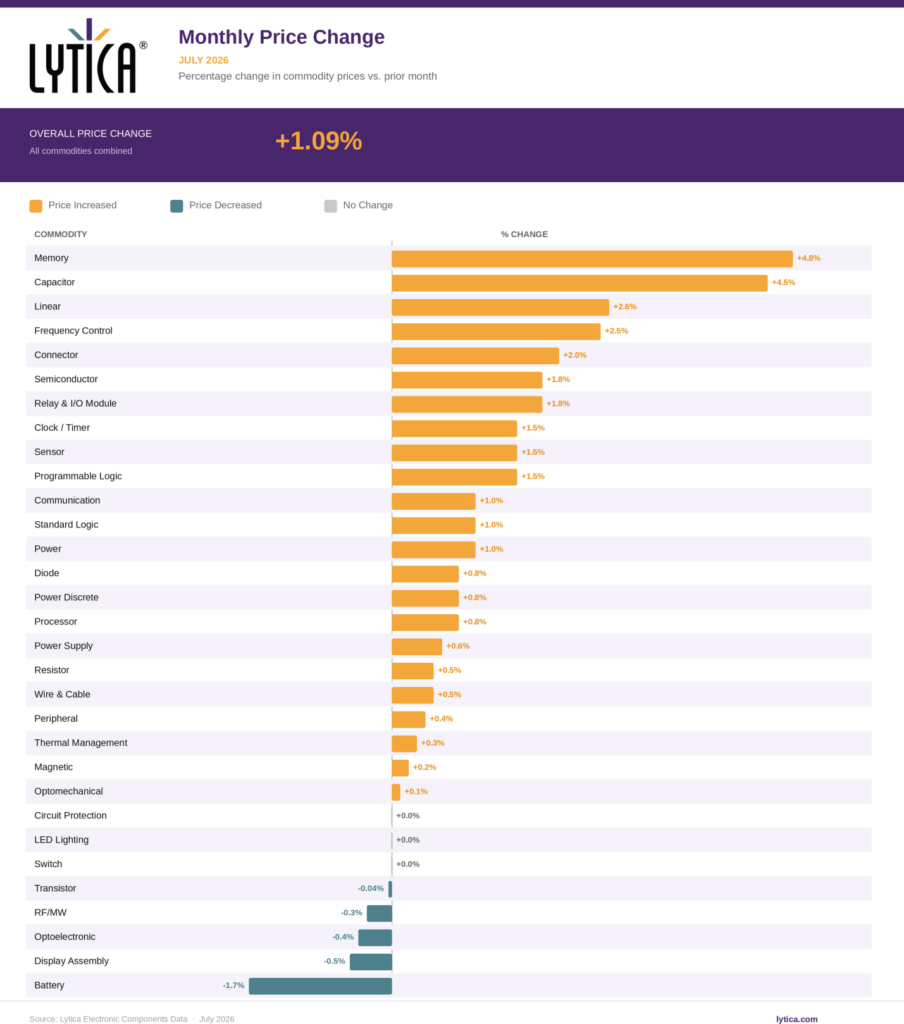
Figure 1: Monthly Price Change by Category – July 2026. Source: Lytica Electronic Components Data.
Memory: Still Rising, but the Pace Has Moderated
Memory remained the highest-inflation category in July at +4.8%. That is still a material monthly increase, but it is a significant deceleration from June’s +9.0%. Availability improved from 91.0% in June to 93.9% in July, while lead times increased +6.7%.
TrendForce projected conventional DRAM contract prices to rise 13-18% quarter over quarter in Q3 2026 and NAND Flash contract prices to increase 10-15%. Capacity reallocation toward server applications continues to limit supply available to conventional markets.
Procurement implication: Slower inflation does not mean the Memory cycle has reversed. Buyers should distinguish between decelerating price growth and falling prices.
Capacitor: July’s Sharpest New Price Acceleration
Capacitor rose +4.5% in July, nearly double June’s +2.3% increase. Availability improved from 85.5% to 89.3%, while lead times remained positive at +3.3%.
TrendForce reported that accelerating AI server platform upgrades and custom ASIC growth have significantly boosted demand for high-end MLCCs. By late June, major Japanese and Korean suppliers had reached their highest book-to-bill ratios since the pandemic period, increasing shortage risk for the second half of 2026.
Procurement implication: Capacitor should now be treated as a price-risk category, not simply a supply-risk category.
Connector: Price Pressure Rises as Demand Strengthens
Connector pricing increased +2.0% in July, up from +0.3% in June, even as lead times compressed slightly by – 1.1%. That combination points more toward pricing and demand strength than immediate supply scarcity.
TE Connectivity reported record fiscal third-quarter net sales of $5.16 billion and record orders of $5.7 billion, up 27% year over year, with management citing broad growth and increasing AI-related momentum across data center and energy infrastructure.
Which Electronic Component Categories Experienced the Largest Lead Time Extensions in July 2026?
The overall lead time index eased from +7.36% in June to +4.89% in July. That is an improvement at the basket level, but the category mix changed dramatically. June’s lead-time leaders – Battery and RF/MW – largely normalized. In July, the strongest pressure moved into Linear, Communication, Power, and Standard Logic.
- Overall lead time index: +4.89% MoM
- Largest extension: Linear +22.1%
- Communication: +19.5%
- Power: +18.9%
- Standard Logic: +18.6%
- Frequency Control: +13.5%
- Power Supply: +12.3%
- Optomechanical: +12.2%
- Largest compression: Semiconductor -10.6%
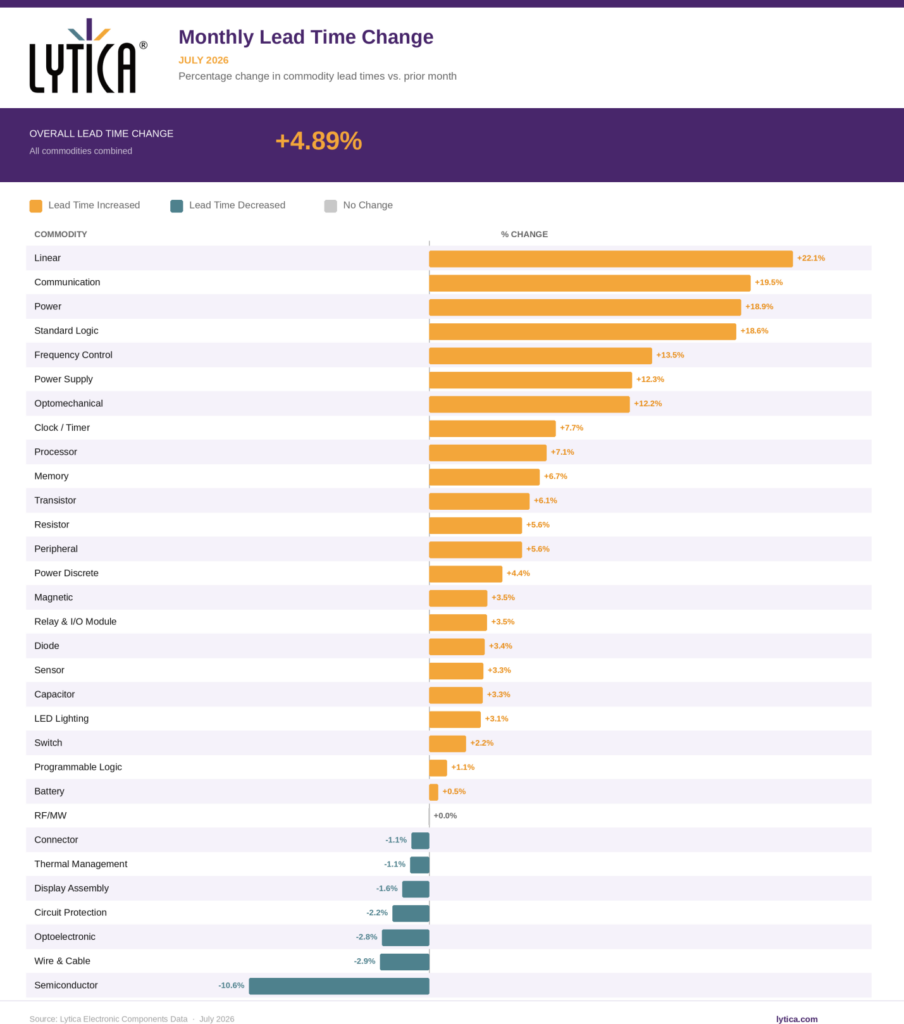
Figure 2: Monthly Lead Time Change by Category – July 2026. Source: Lytica Electronic Components Data.
⚠️ New Risk Alert: Analog and Power Move to the Front of the Queue
The most actionable July signal is the concentration of lead-time extensions in categories tied to analog, power management, communications, and general-purpose logic. Linear increased +22.1%, Communication +19.5%, Power +18.9%, and Standard Logic +18.6%. Yet availability in each category remained above 97%.
The high availability levels matter. This is not yet the pattern of a depleted market. It is a planning-window problem: inventory may still be accessible, but replenishment timing is stretching.
Broader industry data support the shift. Texas Instruments reported Q2 revenue growth of 23% year over year, with broad growth led by industrial, data center, and automotive. Sourceability also noted that AI-related market effects have spread beyond Memory into power, interconnect, and high-performance passive components.
📌 What to Watch:Do not interpret 94% overall availability as evidence that forward coverage is unnecessary. Lead-time expansion can appear before stock availability deteriorates.
Frequency Control: Still the Tightest Category
Frequency Control remains July’s tightest category at 82.4% availability. That is a substantial improvement from 72.7% in June, but it is now paired with +2.5% price and +13.5% lead-time extension.
This is a stronger combined risk signal than June, when price moved only +0.2% and lead time +2.0%. Frequency Control has moved from a primarily availability-driven warning to an active price + lead-time + availability risk.
Battery: June’s Warning Did Not Become a July Price Spike
Battery was the most urgent emerging risk in the June report after lead times increased +21.0% while price moved only +0.1%. July did not produce the expected near-term price catch-up. Price fell -1.7%, lead time increased only +0.5%, and availability improved to 86.1% from 83.7%.
InfoLink reported softer battery-grade lithium carbonate and spodumene prices in mid-July, driven by incremental supply and a more cautious demand outlook. That upstream easing is consistent with the direction of Lytica’s July Battery price data.
What Is the Current Stock Availability for Electronic Components in July 2026?
Overall stock availability improved substantially to 94.0% in July, up from 90.0% in June. Seventeen categories now show availability of at least 95%. Several categories that were notably constrained in June improved materially.
- Relay & I/O Module: 78.8% -> 95.3%
- Wire & Cable: 84.7% -> 95.8%
- Sensor: 88.9% -> 98.9%
- Circuit Protection: 88.4% -> 97.6%
- Communication: 89.8% -> 99.0%
- Frequency Control: 72.7% -> 82.4%
- Resistor: 76.1% -> 83.0%
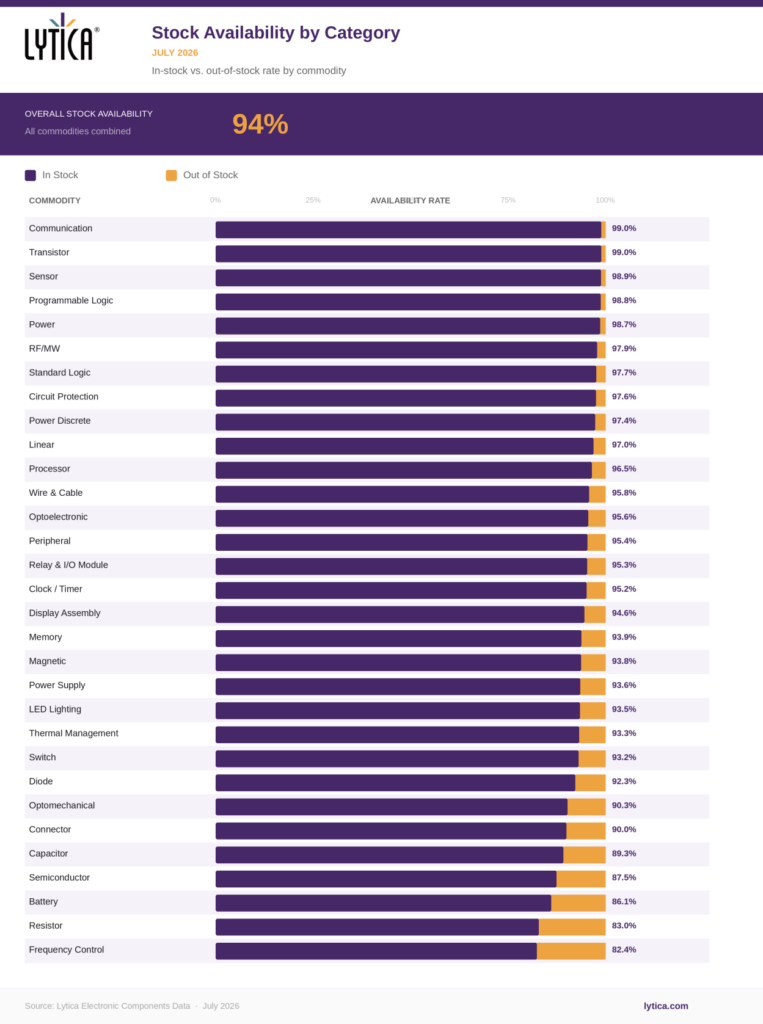
Figure 3: Monthly Stock Availability by Category – July 2026. Source: Lytica Electronic Components Data.
Tightest Availability Categories
Frequency Control – 82.4%: Still the lowest availability in the basket, now combined with +13.5% lead time and +2.5% pricing.
Resistor – 83.0%: Availability improved materially, but remains tight. Lead times are still increasing +5.6%.
Battery – 86.1%: Improving and no longer showing extreme lead-time pressure, but still one of the least available categories.
Semiconductor – 87.5%: The major exception to July’s availability improvement. Availability declined from 93.9% in June even while lead times compressed -10.6%, producing a mixed signal that should be assessed at the MPN level.
Capacitor – 89.3%: Availability improved, but July’s +4.5% price movement makes this a cost exposure even without severe lead-time deterioration.
Key point:July’s availability data reinforce why availability alone cannot be used as a procurement-risk metric. Some of the best-supplied categories in the basket are simultaneously experiencing the largest lead-time extensions.
How Has the Overall Electronic Component Price Index Trended in 2026?
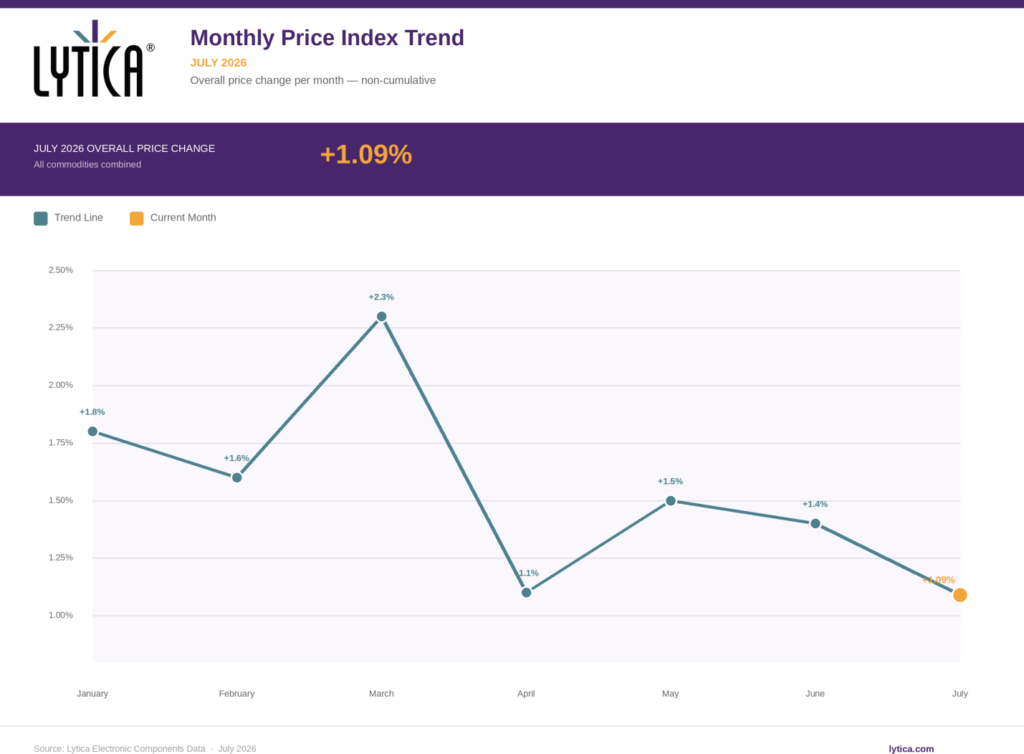
Figure 4: Monthly Price Index Trend – January to July 2026. Source: Lytica Electronic Components Data.
July’s +1.09% reading is the lowest overall monthly increase since April. That is encouraging, but it should not be interpreted as a return to a low-inflation component market. Memory and Capacitor are still rising sharply, and the July lead-time data indicate that cost pressure could rotate into different categories rather than disappear.
Market read: The market is increasingly category-specific rather than universally inflationary.
What Should Procurement Leaders Do Right Now? July 2026 Action Items
🔴 Urgent – Act This Month
Linear: Lead time +22.1%, price +2.6%. Review analog IC demand coverage and supplier commitments now. July data show both cost and delivery pressure.
Frequency Control: Availability 82.4%, lead time +13.5%, price +2.5%. This is the strongest combined risk signal in the July basket.
Memory: Price inflation slowed but remains highest in the market at +4.8%. Maintain forward contract coverage, especially where server, networking, or AI demand affects supply.
Capacitor: Price +4.5% with availability below 90%. Review MLCC exposure and validate high-volume capacitor pricing before Q4 commitments.
🟡 Monitor Closely – 30-60 Day Window
Communication / Power / Standard Logic: All three have very high current availability but lead-time extensions of roughly 19%. Treat this as an early planning signal and secure critical demand before availability begins to reflect the longer replenishment cycle.
Power Supply / Optomechanical: Both posted lead-time extensions above 12% with relatively modest current price movement. Monitor for price follow-through.
Resistor: Tightest availability in the basket at 72.7% for the second consecutive month. Price at +0.2% is far below availability-implied levels. Pricing catch-up has been overdue since April: include in Q3 budget reviews.
Processor: Availability remains only 83.0%. Although supply is improving versus June, flexibility remains limited.
🟢 Improving – Keep on the Watch List
Battery: June’s extreme lead-time warning normalized. Falling upstream material costs supported a -1.7% July price move. Continue monitoring because availability remains only 86.1%.
RF/MW: June’s +16.5% lead-time increase disappeared in July, with lead time flat and price -0.3%.
FAQ: Electronic Component Market - July 2026
Lytica’s overall electronic component price index increased +1.09% month over month in July, down from +1.38% in June. Memory recorded the largest increase at +4.8%, followed by Capacitor at +4.5%, Linear at +2.6%, Frequency Control at +2.5%, and Connector at +2.0%. Five categories declined and three were flat.
Linear recorded the largest increase at +22.1%, followed by Communication (+19.5%), Power (+18.9%), Standard Logic (+18.6%), Frequency Control (+13.5%), Power Supply (+12.3%), and Optomechanical (+12.2%). The overall lead-time index was +4.89%.
At the overall basket level, yes. Stock availability increased from 90.0% in June to 94.0% in July, and 17 categories now have availability at or above 95%. However, Communication, Power, and Standard Logic all have availability above 97% while simultaneously showing lead-time extensions of approximately 19%.
Memory price inflation is decelerating, not reversing. July’s +4.8% increase is well below June’s +9.0%, but it remains the largest increase in the Lytica basket. TrendForce still forecasts rising DRAM and NAND contract prices in Q3, supported by AI and server demand and continued capacity reallocation.
Three things: broad inflation broke apart; June’s Battery and RF/MW lead-time warnings largely normalized; and lead-time pressure rotated into Linear, Communication, Power, and Standard Logic. The practical takeaway is that risk is moving between component categories, making MPN-level visibility increasingly important.
Sources and References
The following sources were consulted to provide broader market context alongside Lytica’s proprietary July 2026 data. June-to-July comparisons use Lytica’s June report as the prior-month published reference.
Lytica, State of the Electronic Components Market: June 2026
TrendForce, AI Server Demand Continues to Support Memory Prices in 3Q26, July 3, 2026
TrendForce, AI Demand for High-End MLCCs Raises Shortage Risks in 2H26, July 6, 2026
Texas Instruments, Q2 2026 Financial Results, July 22, 2026
Sourceability, Q2 2026 Electronics Lead Time Report Highlights, July 14, 2026
TE Connectivity, Fiscal Q3 2026 Results, July 22, 2026
InfoLink Consulting, Lithium Salt Prices Soften Amid Volatility, July 15, 2026