
Lytica is the world’s only buyer-powered agentic AI supply chain platform, built on real buyer-supplier transactional data. The SupplyLens™ Pro platform gives procurement teams the clarity and leverage to cut costs in negotiations, reduce supply risk, and make good decisions from design to source. The world’s top OEMs and EMS providers tell us the same thing: before Lytica, they were operating in the dark.
As a result of this unique position in the marketplace, we’ve been able to work with hundreds of customers in analyzing over $550+ billion in electronics spend. We’ve curated up-to-date insights on the state of the electronic component market and will be sharing them with you each month here. Subscribe today to receive these each month upon release.
Lytica’s component basket of goods used in our analysis is comprised of 165,000 electronic components across more than 30 categories, consisting of the most popular devices used by our customers. These indices are intended to show trends in the market. Individual component and BoM analysis, including risk assessment, is offered by Lytica as a service to our customers. Request a demo to see it in action.
⚡ Key Takeaway Summary
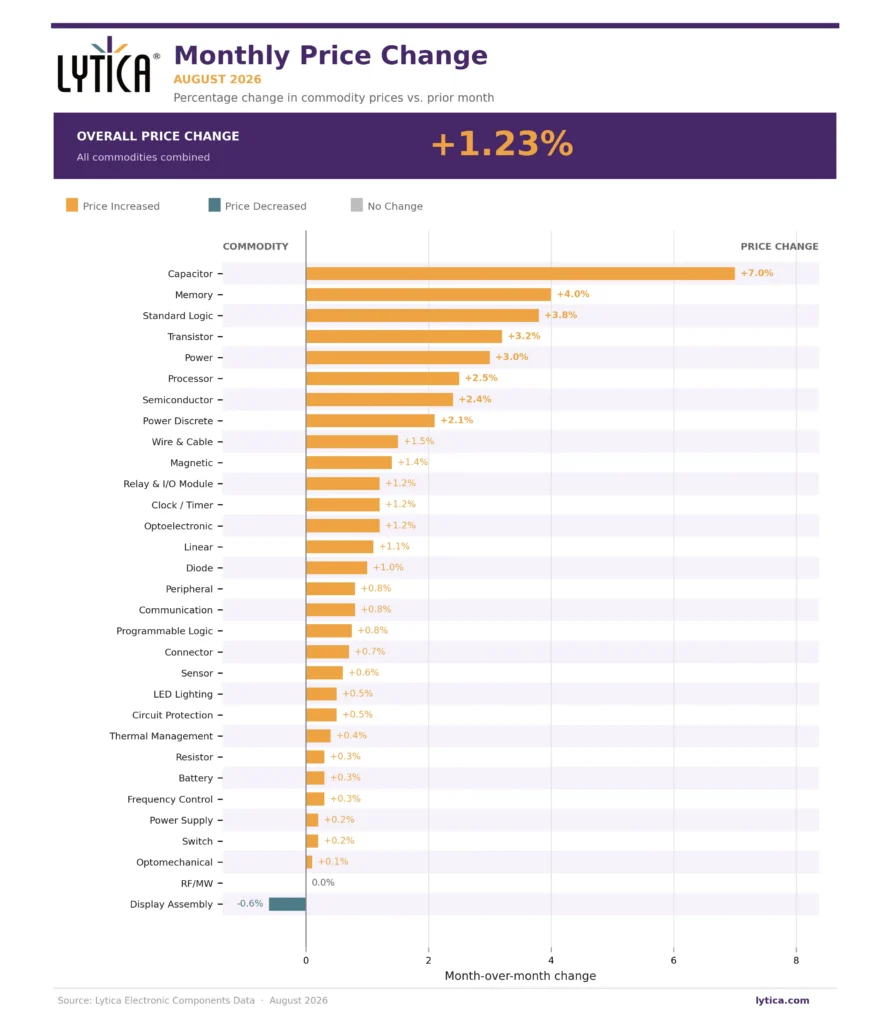
August marked a meaningful change in the electronic component market. The overall price index increased +1.23% month over month, up from +1.09% in July. Price increases also broadened again: 29 of the 31 categories tracked in this report moved higher, one was flat, and only one declined.
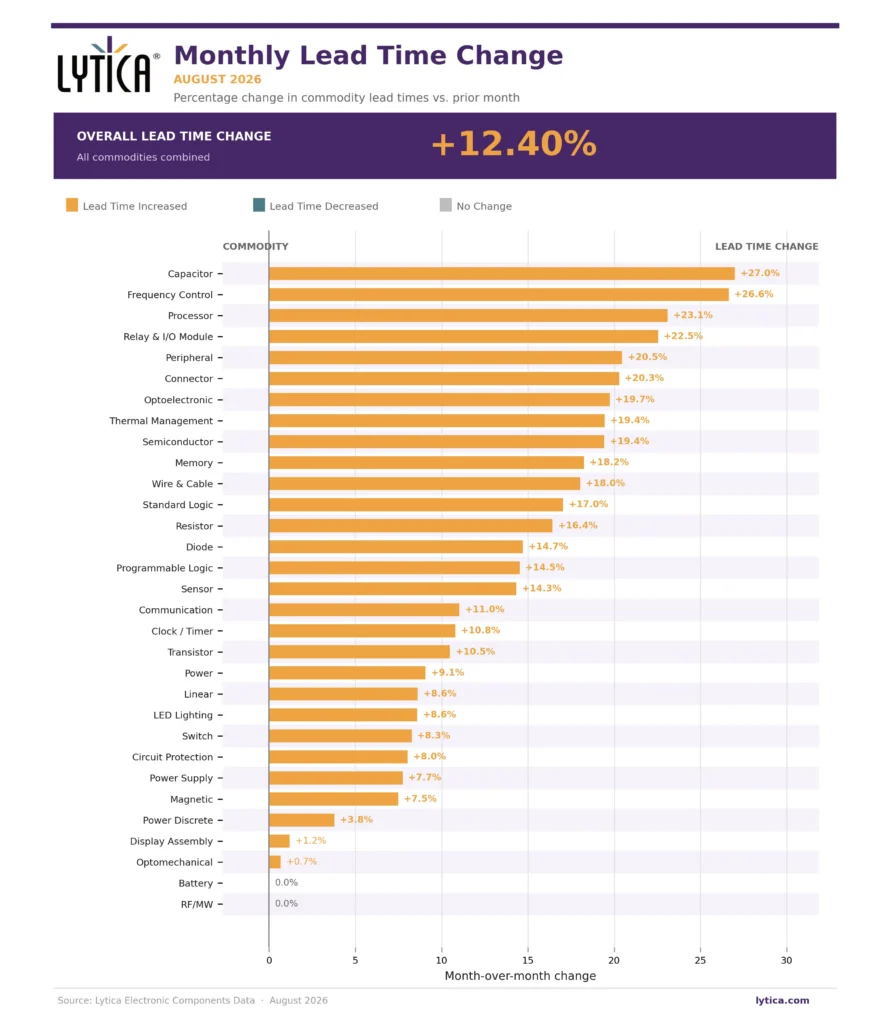
The more important signal was lead time. The overall lead time index jumped to +12.40% in August, more than 2.5 times July’s +4.89%. Twenty-nine categories posted longer lead times, and none compressed. Capacitor (+27.0%), Frequency Control (+26.6%), Processor (+23.1%), Relay & I/O Module (+22.5%), Peripheral (+20.5%), and Connector (+20.3%) led the increase.
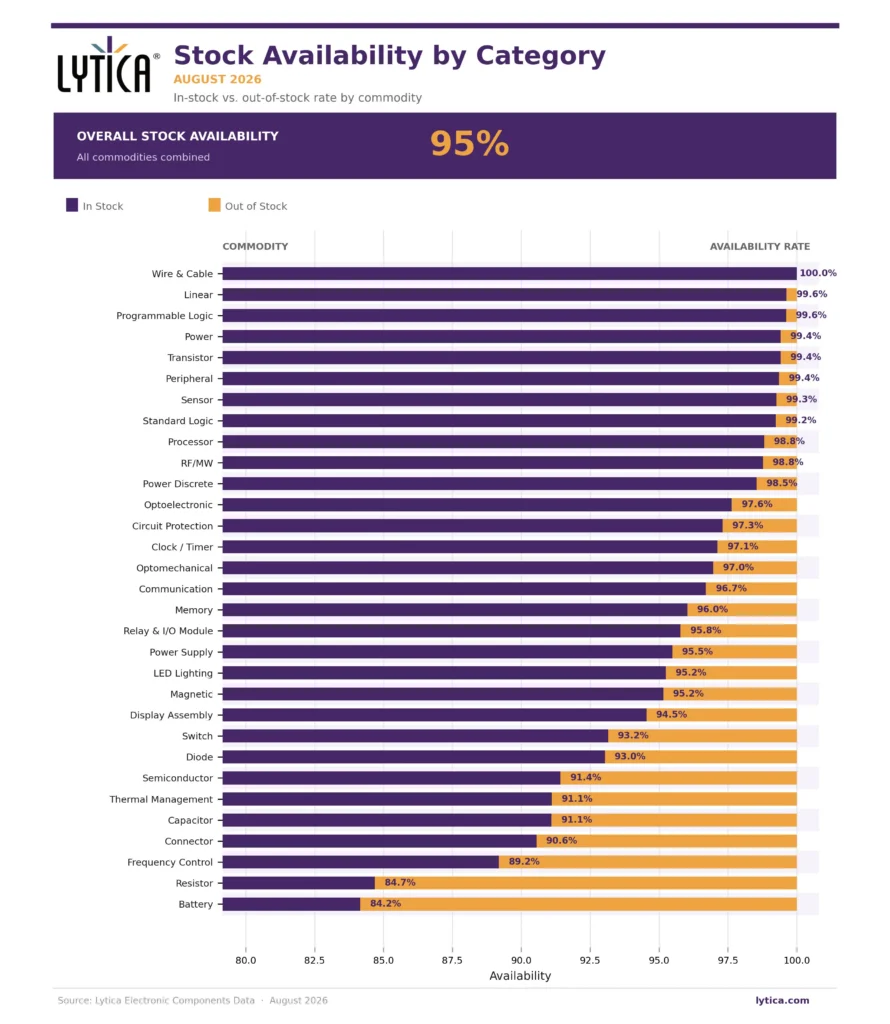
Stock availability improved to 95.0% overall, up from 94.0% in July. That divergence matters: current inventory remains broadly available, while replenishment windows are stretching rapidly. In other words, the market is not broadly short today, but the time required to replace inventory is getting longer.
Capacitor is August’s clearest combined risk signal: price increased +7.0%, lead time extended +27.0%, and availability remained only 91.1%. Memory (+4.0%), Standard Logic (+3.8%), Transistor (+3.2%), Power (+3.0%), Processor (+2.5%), and Semiconductor (+2.4%) also posted material price increases.
Action required: Prioritize Capacitor, Frequency Control, Processor/Semiconductor, Memory, and Resistor for Q4 supply and cost reviews. Treat August’s lead-time surge as an active planning signal even where current availability still appears healthy.
What Drove Electronic Component Price Changes in August 2026?
After July’s cooling, price pressure moved modestly higher again in August. The overall price index rose to +1.23% from +1.09% in July. Inflation also broadened: 29 of 31 tracked categories increased, RF/MW was flat, and Display Assembly was the only category to decline (-0.6%).
- Overall price index: +1.23% MoM, up from +1.09% in July
- Highest increase: Capacitor +7.0%
- Memory: +4.0%
- Standard Logic: +3.8%
- Transistor: +3.2%; Power: +3.0%
- Eight categories increased by at least +2.0%
- Only decline: Display Assembly -0.6%; RF/MW was flat
Capacitor: August’s Strongest Price and Lead-Time Signal
Capacitor prices increased +7.0% in August, up from +4.5% in July. Lead times simultaneously extended +27.0%, the largest increase in the August dataset, while availability improved only modestly to 91.1%. This is the strongest combined cost and supply signal in the report.
TrendForce reported in late August that Samsung Electro-Mechanics had begun raising 4Q26 prices directly for OEM and ODM customers, with estimated increases of 25–30% for some consumer-grade X5R products and 10–20% for high-end X6S products used in AI servers. TrendForce described the move as the start of an MLCC industry upcycle, driven by AI-server demand, capacity reallocation, and rising supplier utilization.
Procurement implication: Capacitor should be treated as an active Q4 negotiation and coverage priority. Validate contract exposure at the MPN level and separate general-purpose capacitor risk from high-capacitance and AI-adjacent MLCC exposure.
Memory: Price Growth Moderates, but Replenishment Risk Rises
Memory remained the second-highest inflation category in August at +4.0%, down from +4.8% in July. The monthly price increase is moderating, but lead times moved sharply in the opposite direction, rising +18.2%. Availability improved to 96.0%, reinforcing the broader August pattern of healthy current stock paired with longer replenishment windows.
TrendForce reported in August that memory contract prices remain supported by aggressive AI and cloud infrastructure investment, with capacity allocation and long-term agreements continuing to tighten supply available to conventional applications. Its August DRAM research also noted that OEMs are building inventory and using long-term agreements as they prepare for future supply contraction.
Two highly plausible reasons for a much smaller growth rate in pricing this quarter
- Consumer market has reached the end of its ability to absorb the price increases and
- LTA’s are now largely in effect, thereby capping out increases quarter over quarter. Micron’s June 2026 investor call spoke to the fact that 80% of their revenue is still not under contract. The goal is to get 50% covered by LTA or Strategic Customer Agreement (SCA) as Micron calls it.
What this means therefore is 50% is still potentially subject ot QoQ price increases until capacity comes online, which isn’t expected anytime soon.
Procurement implication: Slower monthly price inflation should not be read as a reversal in the Memory cycle. Forward coverage remains important where DRAM, NAND, server, networking, or AI infrastructure demand competes for capacity.
Semiconductor and Power Categories Re-Accelerate
August also showed broader repricing across semiconductor categories. Standard Logic increased +3.8%, Transistor +3.2%, Power +3.0%, Processor +2.5%, Semiconductor +2.4%, and Power Discrete +2.1%. Several of these categories also posted double-digit lead-time extensions.
External demand signals support the direction of the data. Analog Devices reported record fiscal third-quarter revenue of $4.02 billion, up 40% year over year, with growth led by Data Center and Industrial. Infineon also reported record quarterly sales and identified AI data-center power supply solutions as its most important growth driver, while automotive orders were improving.
Procurement implication: The August signal is broader than a single semiconductor family. Buyers should review analog, power, logic, processor, and discrete coverage together rather than assuming pressure remains isolated to Memory.
Which Electronic Component Categories Experienced the Largest Lead Time Extensions in August 2026?
Lead time is the defining signal in the August report. The overall index increased to +12.40%, up from +4.89% in July. Twenty-nine of the 31 categories tracked here posted longer lead times, while Battery and RF/MW were flat. No category recorded a lead-time compression.
- Overall lead time index: +12.40% MoM
- Capacitor: +27.0%
- Frequency Control: +26.6%
- Processor: +23.1%
- Relay & I/O Module: +22.5%
- Peripheral: +20.5%
- Connector: +20.3%
- Optoelectronic: +19.7%; Thermal Management: +19.4%; Semiconductor: +19.4%
- Memory: +18.2%; Wire & Cable: +18.0%; Standard Logic: +17.0%; Resistor: +16.4%
⚠️ Risk Alert: Lead-Time Pressure Becomes a Market-Wide Signal
July’s lead-time pressure was concentrated in a smaller set of categories. In August, the pattern became much broader. Several categories that were compressing or only modestly extending in July moved sharply higher in August: Semiconductor shifted from -10.6% to +19.4%, Connector from -1.1% to +20.3%, Wire & Cable from -2.9% to +18.0%, and Thermal Management from -1.1% to +19.4%.
At the same time, Analog Devices reported strengthening demand across its product portfolio and regions, while Infineon cited very high demand for AI data-center power solutions. Those external signals are consistent with the broader delivery-window pressure showing up in Lytica’s August data.
What to watch: August is no longer a category-specific lead-time warning. It is a market-wide planning signal. Procurement teams should revalidate quoted lead times and confirmed delivery windows before relying on current inventory availability as a proxy for future supply.
Frequency Control: Price Has Not Caught Up to the Lead-Time Signal
Frequency Control lead times increased +26.6% in August, the second-largest extension in the dataset. Availability improved from 82.4% in July to 89.2%, but remains among the lowest categories in the basket. Price increased only +0.3%.
That combination – very large lead-time expansion, below-average availability, and minimal current price movement – makes Frequency Control one of August’s clearest pre-repricing watch items.
Resistor: Tight Availability Meets a New Lead-Time Surge
Resistor availability improved slightly to 84.7%, but remains the second-lowest in the basket. Lead times increased +16.4% while price moved only +0.3%. Like Frequency Control, the gap between delivery pressure and pricing is more important than the current headline price movement.
What Is the Current Stock Availability for Electronic Components in August 2026?
Overall stock availability improved to 95.0% in August, up from 94.0% in July. Twenty-one of the 31 tracked categories now show availability of at least 95%. The broad supply picture therefore looks healthy on current stock, but that needs to be read alongside the +12.40% lead-time index.
- Memory: 93.9% -> 96.0%
- Processor: 96.5% -> 98.8%
- Semiconductor: 87.5% -> 91.4%
- Frequency Control: 82.4% -> 89.2%
- Wire & Cable: 95.8% -> 100.0%
- Battery: 86.1% -> 84.2% – the largest notable deterioration among the tightest categories
Tightest Availability Categories
Battery – 84.2%: The lowest availability in the August basket. Lead time was flat and price increased only +0.3%, so the current signal is inventory tightness rather than a delivery-window spike.
Resistor – 84.7%: Still one of the tightest categories, now paired with a +16.4% lead-time increase.
Frequency Control – 89.2%: Availability improved substantially, but +26.6% lead-time growth keeps the category high risk.
Connector – 90.6%: Availability remains below the market average while lead times increased +20.3%.
Capacitor – 91.1%: Availability improved, but the combination of +7.0% price and +27.0% lead time makes it the most acute combined risk category.
Key point: August reinforces the distinction between stock availability and replenishment risk. The market can show 95% current availability while delivery windows are simultaneously extending at double-digit rates.
How Has the Overall Electronic Component Price Index Trended in 2026?
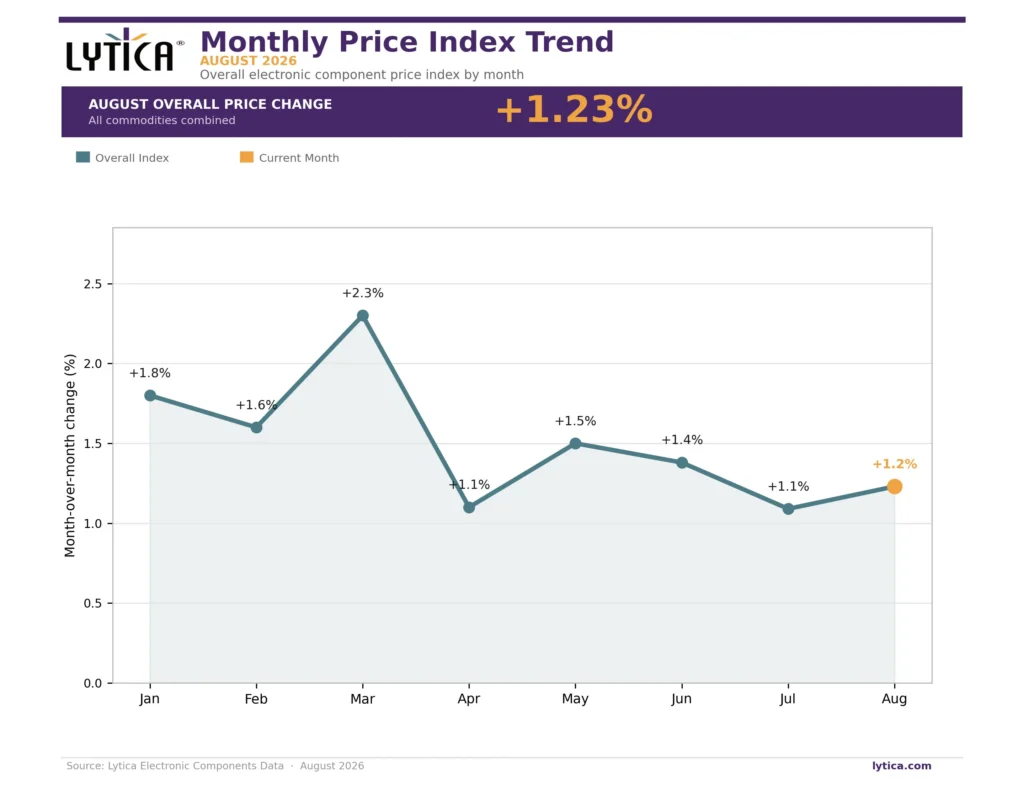
August’s +1.23% reading reverses part of July’s cooling, but remains below the June and May levels. The headline index is not returning to the March peak; instead, price pressure is broadening again while lead-time stress rises much faster than the overall price index.
Market read: The August market is defined less by a dramatic headline price spike than by a broad lead-time reset that could create future cost and availability pressure across multiple categories.
What Should Procurement Leaders Do Right Now? August 2026 Action Items
🔴 Urgent – Act This Month
Capacitor: Price +7.0%, lead time +27.0%, availability 91.1%. Review MLCC exposure, validate supplier commitments, and prioritize high-capacitance, AI-adjacent, automotive, and high-reliability requirements.
Frequency Control: Lead time +26.6% with only +0.3% price movement and 89.2% availability. Treat as a pre-repricing and coverage risk.
Processor / Semiconductor: Lead times +23.1% and +19.4%, with price increases of +2.5% and +2.4%. Revalidate delivery assumptions for Q4 and early 2027 builds.
Memory: Price +4.0%, lead time +18.2%. Maintain forward coverage even as monthly price inflation moderates.
🟡 Monitor Closely – 30-60 Day Window
Standard Logic / Transistor / Power: Prices increased +3.8%, +3.2%, and +3.0%, respectively. These categories now carry more direct cost pressure than they did in July.
Connector / Wire & Cable: Lead times increased +20.3% and +18.0%. Copper also traded near record highs in late August, adding an input-cost risk to wire and cable even where current availability remains strong.
Resistor: Availability remains only 84.7% and lead time increased +16.4%, while price is still only +0.3%.
Stable / Improving – Keep on the Watch List
RF/MW: Price and lead time were both flat in August, making it one of the few categories without new upward pressure.
Display Assembly: Price declined -0.6% and lead time increased only +1.2%, the softest price environment in the August basket.
Linear / Communication / Power: Lead-time growth moderated from July’s extreme levels, although all three remain positive and Power pricing accelerated to +3.0%.