Electronics Market Continues to Show Signs of Stabilizing
Lytica is the world’s only provider of electronic component spend analytics and risk intelligence using real customer data. As a result of our unique position in the marketplace, we’ve been able to work with 100+ customers in analyzing over $425 billion in electronics spend. We’ve curated up-to-date insights on the state of the electronic component market and will be sharing them with you each month.
Lytica’s component basket of goods used in our analysis is comprised of 15,800 electronic components across more than 30 categories, consisting of the most popular devices used by our customers. These indices are intended to show trends in the market. Individual component and BoM analysis is offered by Lytica as a service to our customers.
Electronic Component Pricing Stagnate in March
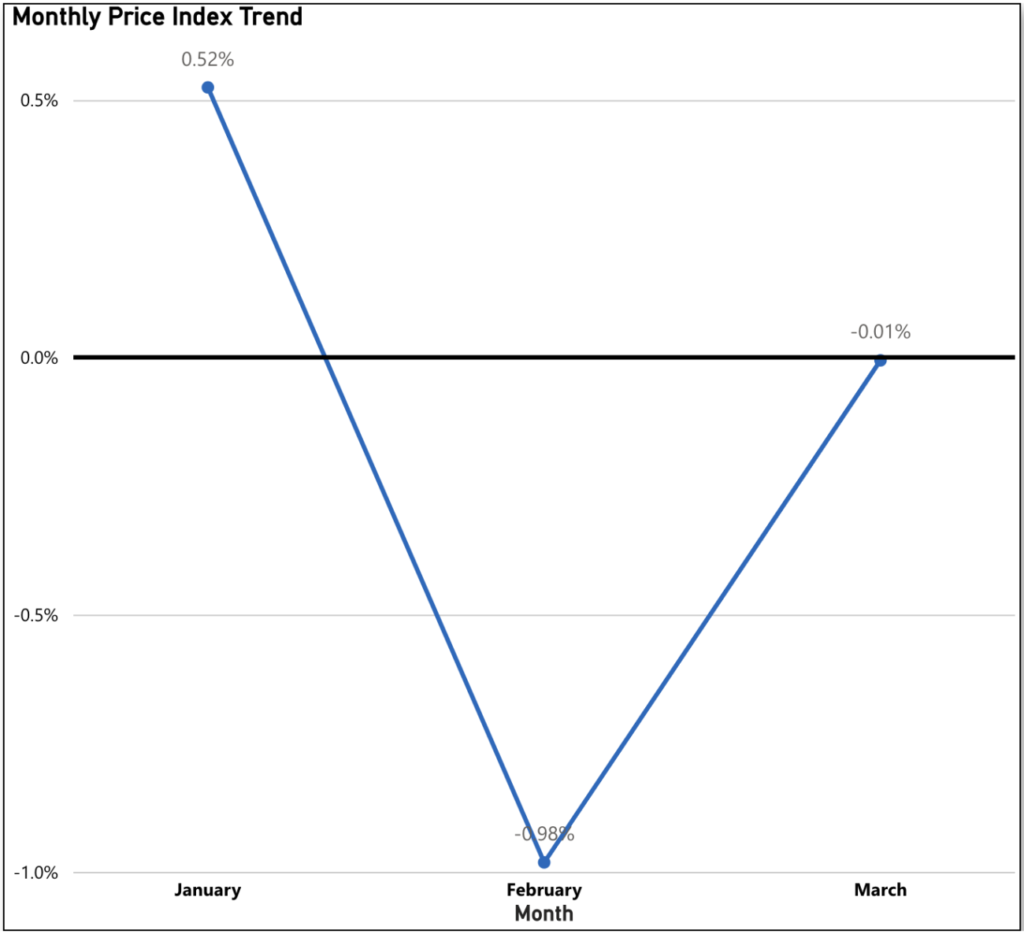
March sees a minimal shift in electronic component pricing, with an overall decrease of just 0.01%. While this may disappoint those anticipating a further decline following February’s 0.98% drop, it does prompt consideration as to whether prices are beginning to stabilize. Nevertheless, this maintains the trend of prices decreasing for 11 out of the last 15 months since January 2023.
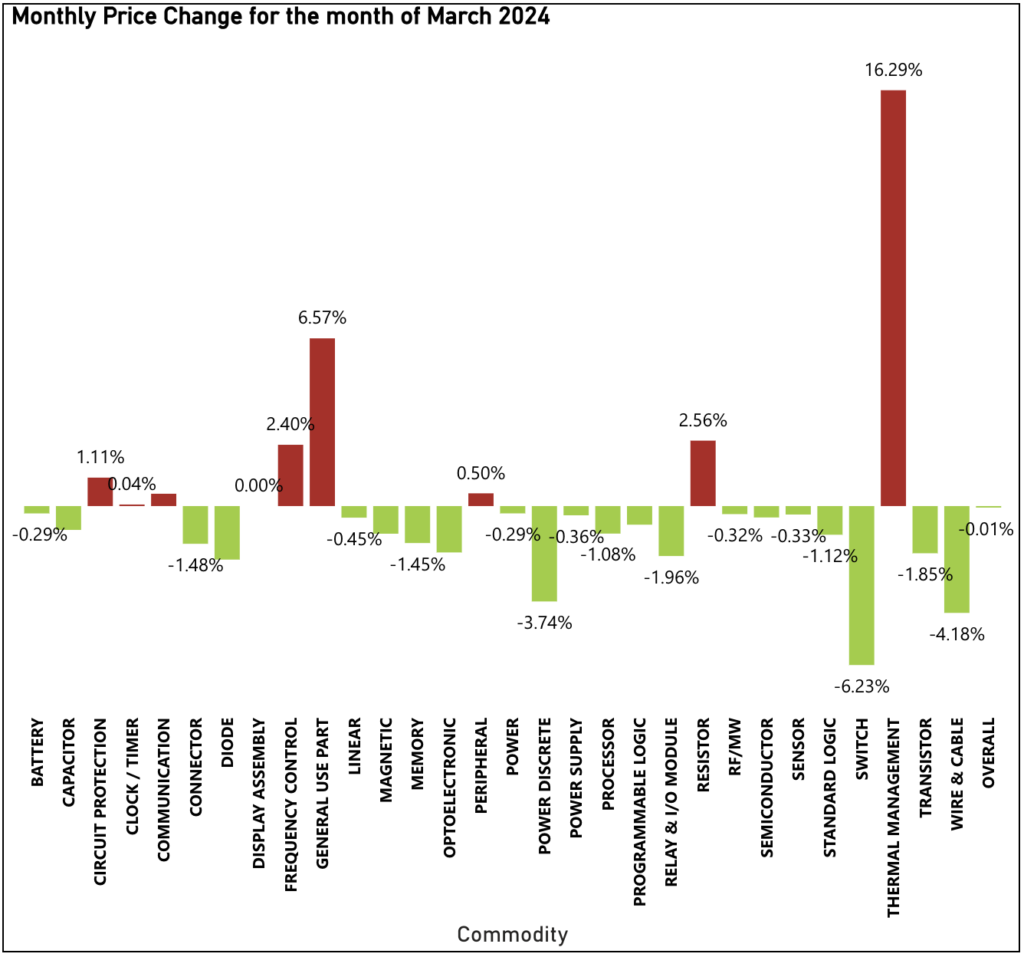
The biggest drivers in this pricing readout include Switch (down 6.23% Month-to-Month, following a 3.34% increase in February), Wire & Cable (down 4.18% Month-to-Month), and Power Discrete (down 3.74% Month-to-Month).
The commodities pushing upward against this trend include Thermal Management (up 16.29% Month-to-Month, following no change in February), General Use Part (up 6.57% Month-to-Month following a previous decrease of 5.06% Month-to-Month) and Resistor (up 2.56% Month-to-Month following a previous decrease of 1.73% Month-to-Month), among others.
Lead Time Decreases Continue in March but at Slower Rates
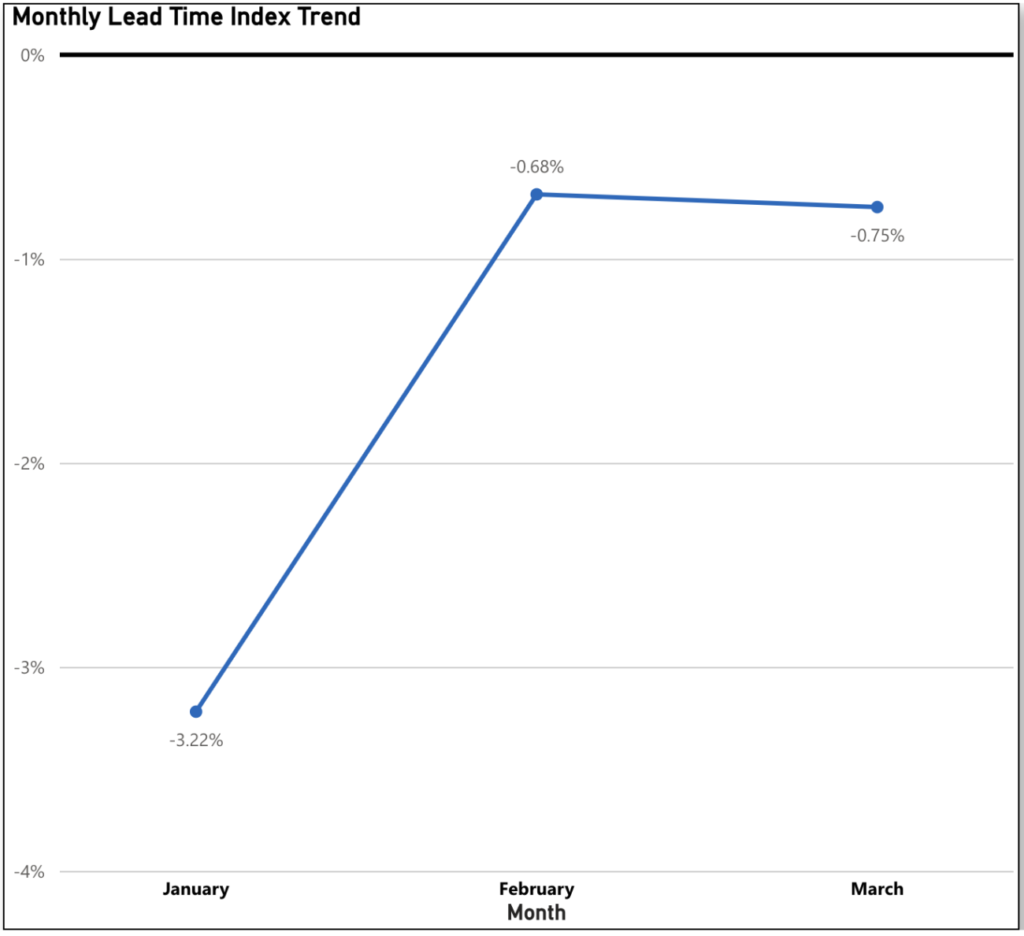
The trend of decreasing lead times persists into March, which is encouraging for buyers. However, the average lead time saw only a modest Month-to-Month decrease of 0.75%, slightly more than the 0.68% decrease noted in February. While this does align with the ongoing pattern of decreasing lead times seen throughout 2023, the size of the decreases is getting smaller. This further supports the notion that lead times may be stabilizing.
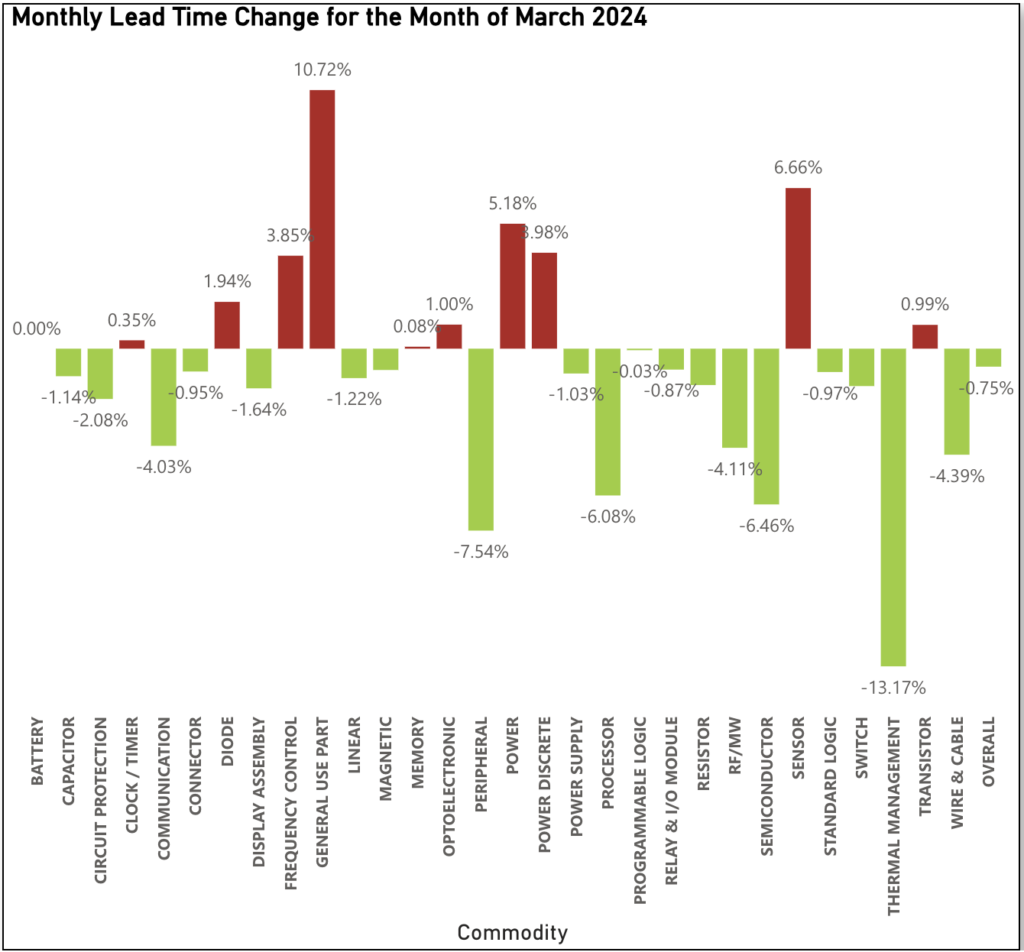
The decrease in lead times was driven largely by Thermal Management (down 13.17% Month-to-Month, following an increase of 16.35% in February), Peripheral (down 7.54% Month-to-Month, following an increase of 1.79% in February) Semiconductor (down 6.46% Month-to-Month, following a decrease of 10.64% in February), and Processor (down 6.08% Month-to-Month).
Those commodities pushing back on March’s trend included General Use Part (up 10.72% Month-to-Month), Sensor (up 6.66% Month-to-Month), and Power (up 5.18% Month-to-Month).
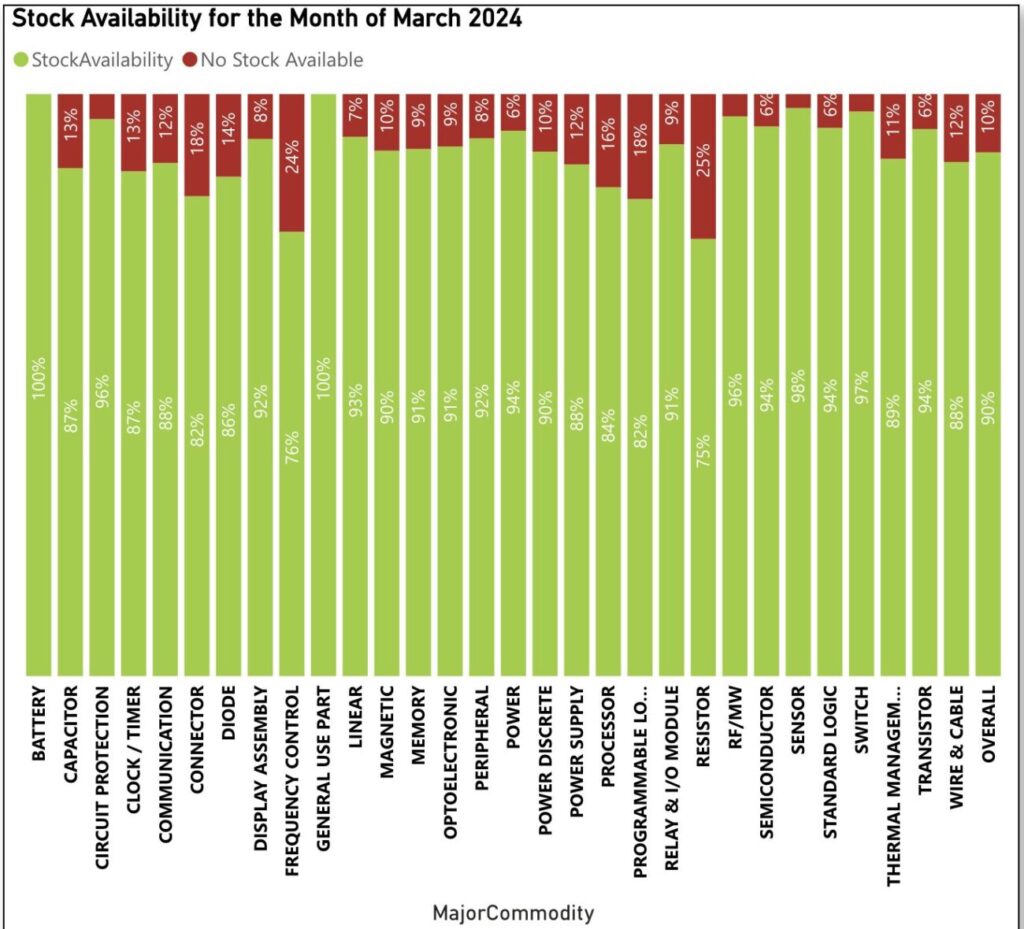
Electronic Component Availability Sees Highest Level in Over a Year
In March, electronic component availability was at 90% on average, an increase from 87% of all tracked electronic components available in February 2024. This will come as a positive note for buyers, as this is the highest stock level recorded since before 2023 (the highest in 2023 being 89% in December). Those components leading the way from an availability perspective in March included Battery and General Use Parts (both at 100% available), Sensor (at 98% available) and Switch (at 97% Available).
Sign up for our newsletter for more on the electronic components market. Also stay tuned for our Q1 2024 State of the Electronic Component Market update coming shortly.